Device Dashboard
The Device Dashboard is the central workspace for monitoring real-time vehicle and device data. It helps you track key metrics such as location, speed, RPM, and custom signals, whether you manage one vehicle or an entire fleet.
In this guide, you will learn how to:
- Create and manage device dashboards
- Add and configure widgets
- Use dashboard actions effectively
- Build a custom widget from OBD data end-to-end
The dashboard supports the following visualization types:
- Line chart
- Area chart
- Map
- Gauge
- Bar chart
- Pie chart
- State timeline
- Linear gauge
- Numeric
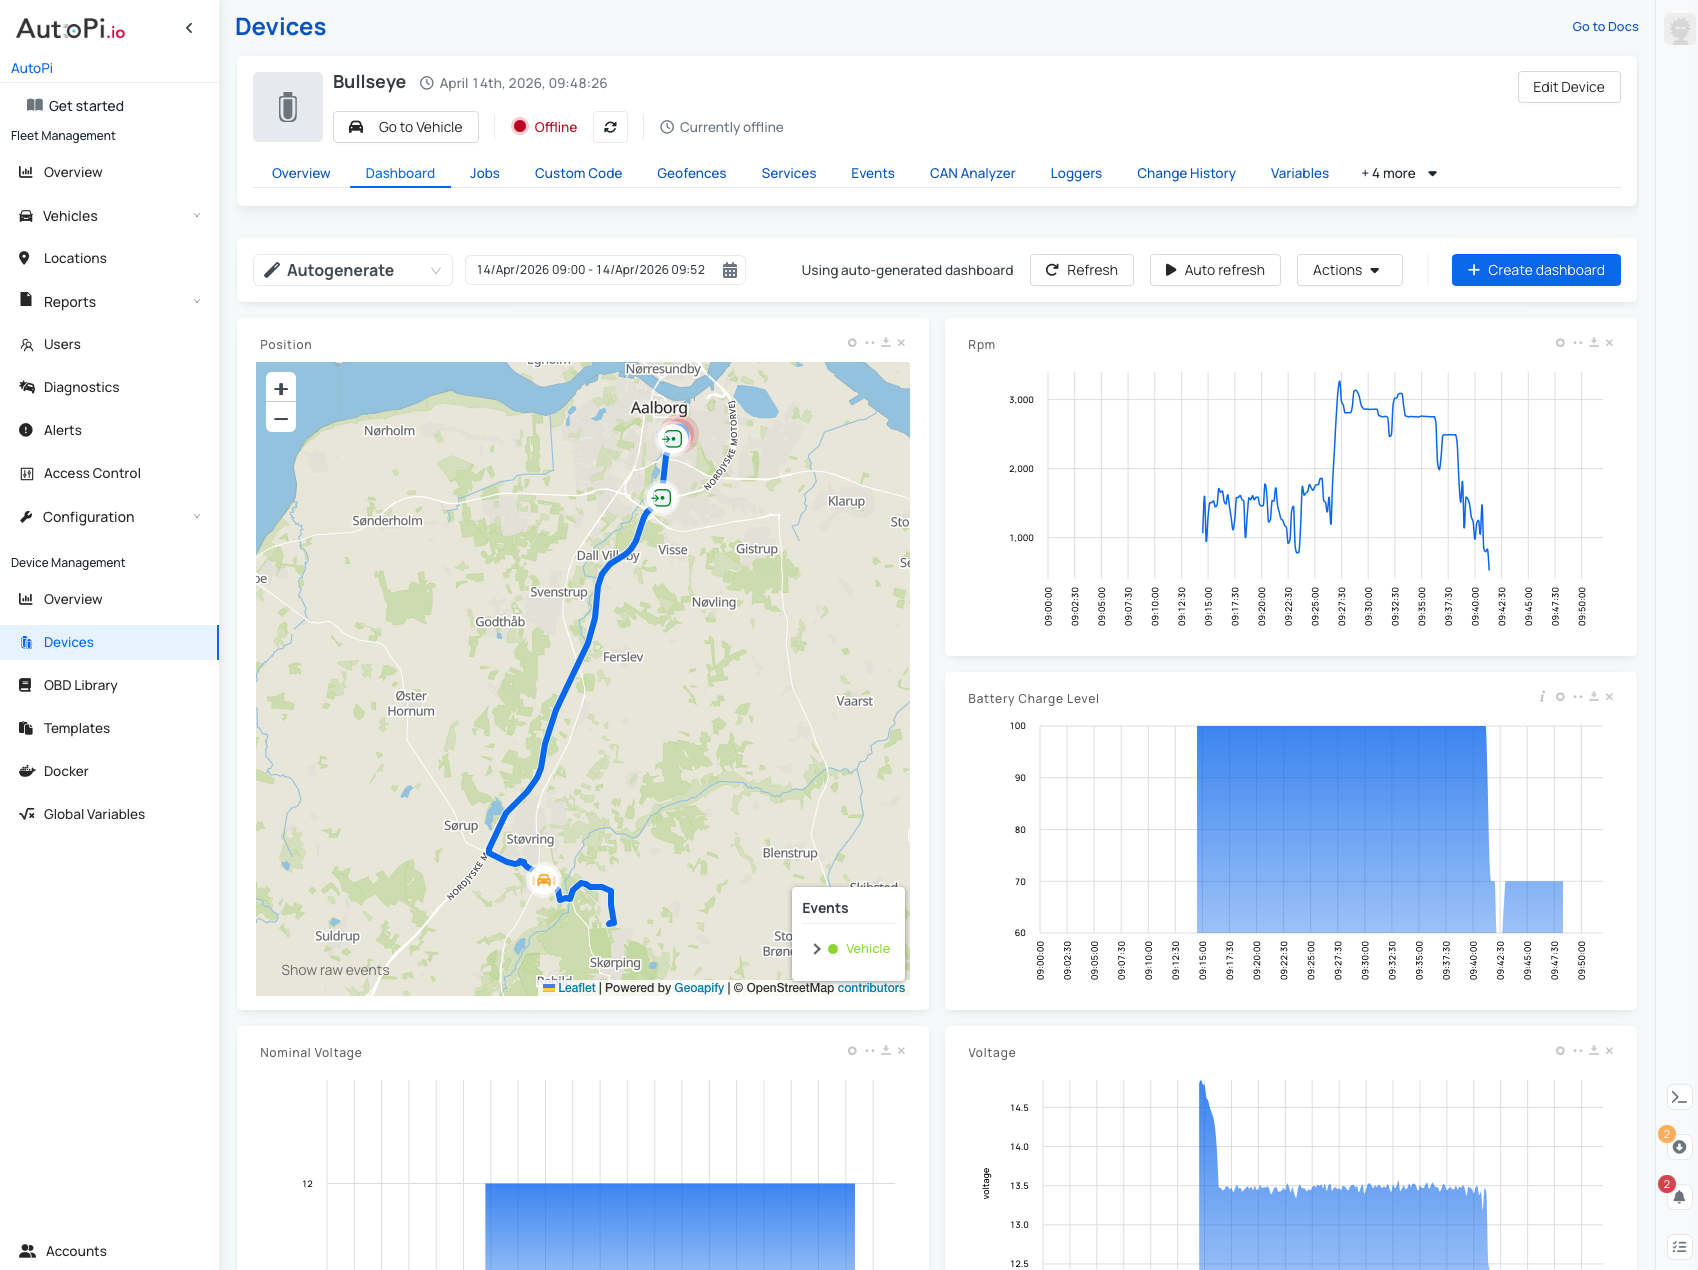
Use the date range filter to analyze specific time periods. You can also create custom widgets to display only the signals you need. If you are starting from scratch, use Autogenerate to create an initial dashboard based on the most recent data received from the device.
You can create and manage multiple dashboards for different monitoring use cases.
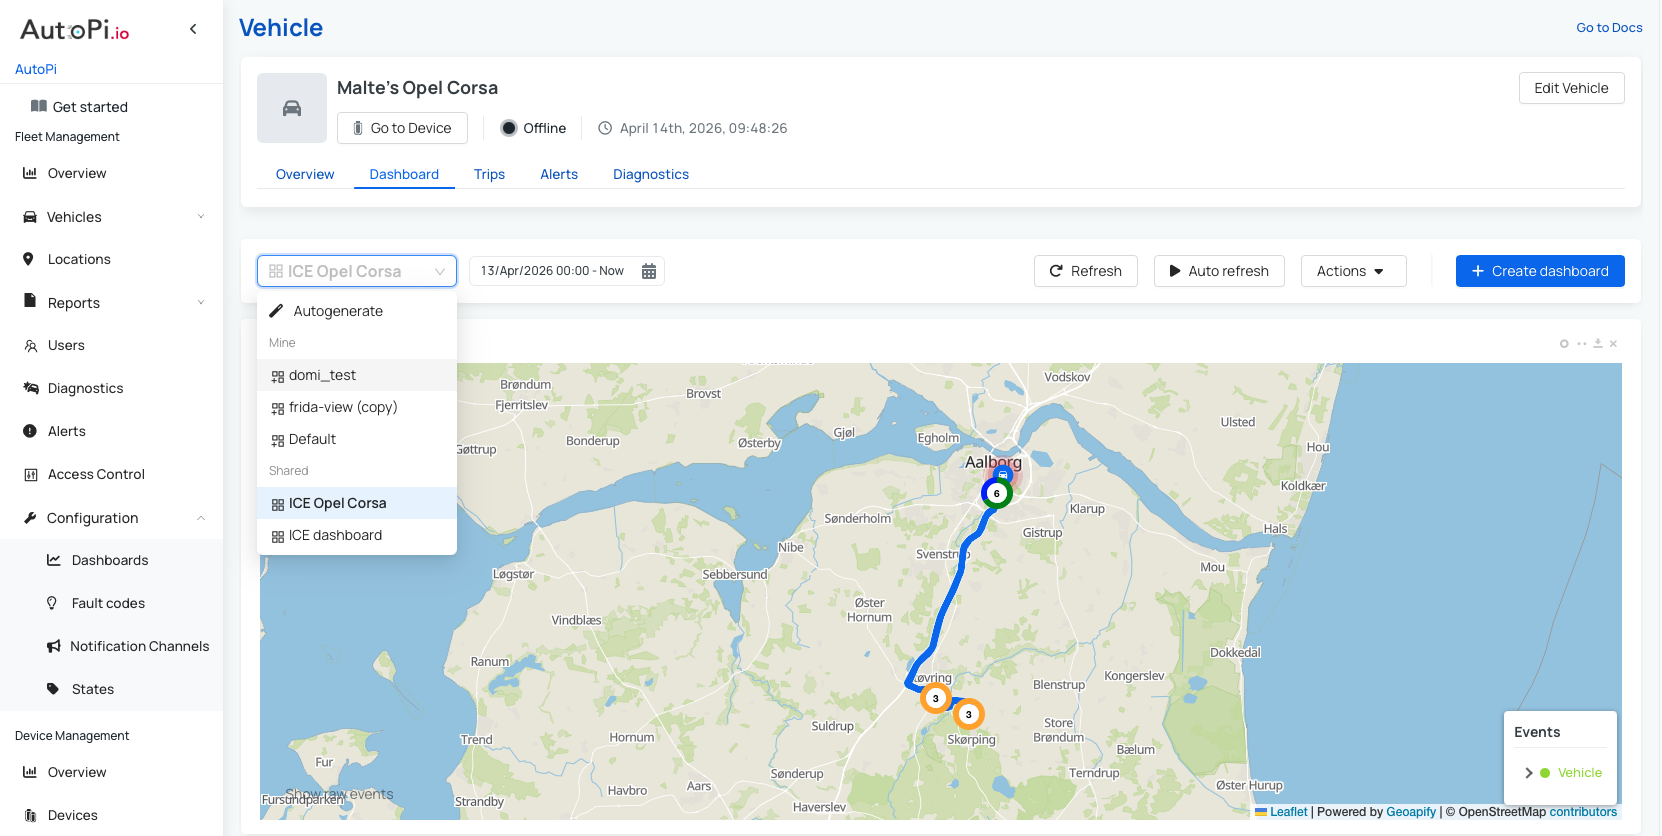
Dashboard Types
There are three dashboard types:
- Autogenerated: Created automatically from device data.
- Mine: Dashboards created by the current user.
- Shared: Dashboards shared by an admin in your organization (visible in the Vehicle Dashboard view).
With admin permissions, you can create shared dashboards and assign them to vehicles by type or make/model. For details, see Creating a Shared Dashboard.
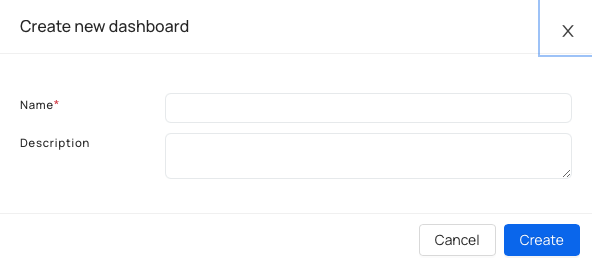
Create a New Device Dashboard
To create a dashboard:
- Navigate to Device > Dashboard.
- Click Create dashboard.
- Enter:
- Name: A clear dashboard name.
- Description (optional): A short description of its purpose.
- Click Create.
Adding Widgets to the Dashboard
Use real device data when possible to validate widget configuration.
The Autogenerate option creates widgets automatically from available device data. This is a practical starting point when creating a dashboard from scratch.
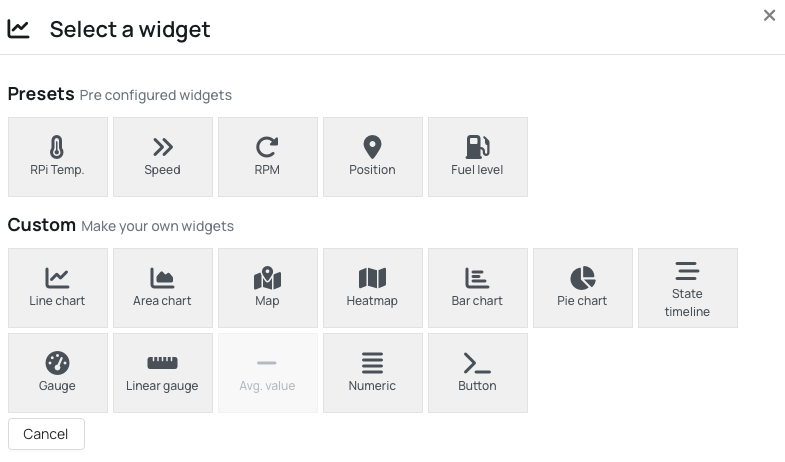
To add a widget manually:
- Navigate to the Dashboard and click Actions.
- Click Add widget.
- Select a widget type.
- Configure the widget:
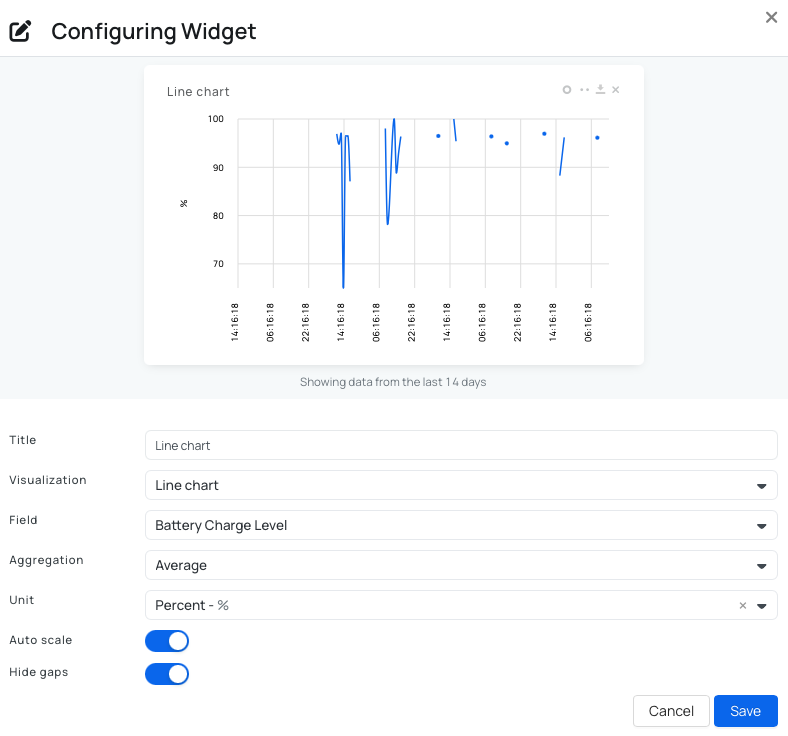
- Title: Widget display name.
- Visualization: Chart or display type (line chart, map, gauge, and so on).
- Field: Logger or signal to display.
- Aggregation: Average, minimum, maximum, sum, or raw data.
- Unit: Unit shown in the widget.
- Auto scale: Scales values automatically to fit the visualization.
- Hide gaps: Shows or hides periods with no data.
- Click Save in the widget editor, then save the dashboard.
Widget Controls
Each widget has the following controls in the top-right corner:
| Icon | Action |
|---|---|
| Circle (refresh) | Refresh the data displayed in the widget |
| Two-dot (edit) | Open the widget editor |
| Download | Download the data for this widget only |
| X (delete) | Remove the widget from the dashboard |
Editing a Widget
To edit a widget, click Edit in the top-right corner of the widget. Update the settings in the configuration dialog, then save your changes.
Dashboard Actions
The following actions are available for each device dashboard:
| Action | Description |
|---|---|
| Restore to default | Resets the dashboard to the default widget layout. |
| Save as default | Sets this dashboard as the default view shown when opening the Dashboard tab for a device. |
| Download all data | Downloads all data currently shown on the dashboard, based on the selected time range and all visible widgets. |
| Show Events | Redirects to the Events page with the time range pre-filtered to match the current dashboard view. |
| Edit | Opens the dashboard for editing. |
| Duplicate | Creates a copy of the dashboard, useful as a starting point for a new layout. |
| Delete | Permanently removes the dashboard. |
How to Add a New Widget from Scratch
This workflow shows how to create a widget from OBD data collected directly from your vehicle. The process has three steps:
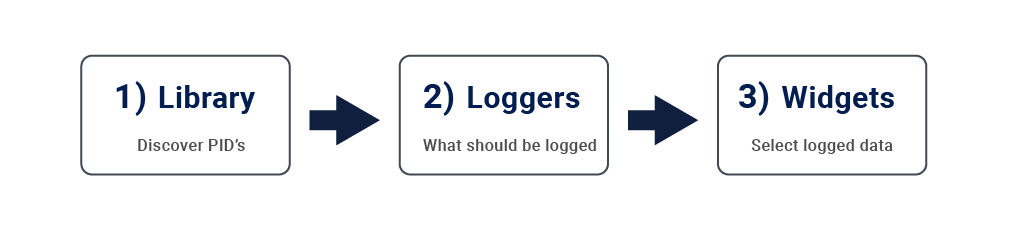
Follow the steps below in order.
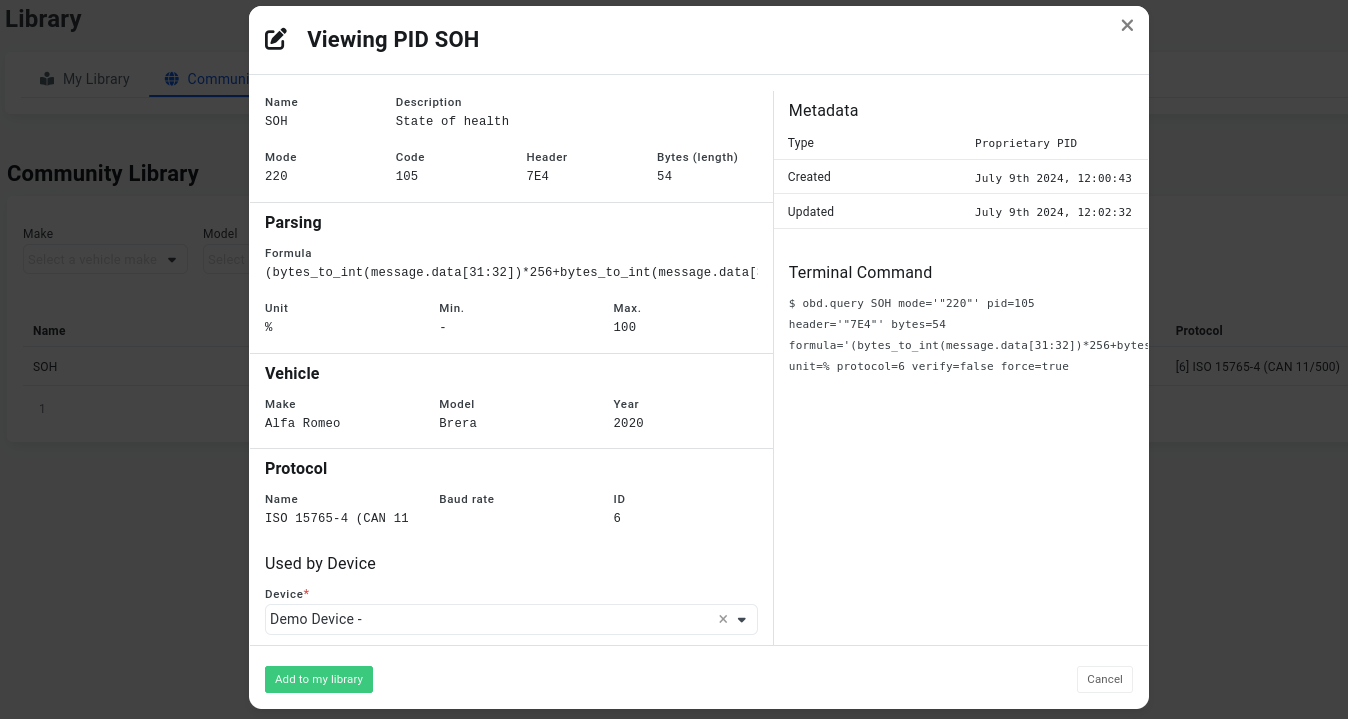
Step 1: Library - Find the PID
Use the OBD library to identify the signal you want to log. The library has two sections:
- Your library: Commands specific to your vehicle, extracted automatically or added manually.
- The community library: Commands available globally in the AutoPi platform.
If you find a relevant command in the community library, add it to your own library first.
You can create loggers only from commands in your own library.
Step 2: Loggers - Configure Data Collection
After selecting a PID, configure logging for the device. Go to Devices > Loggers and click Create:
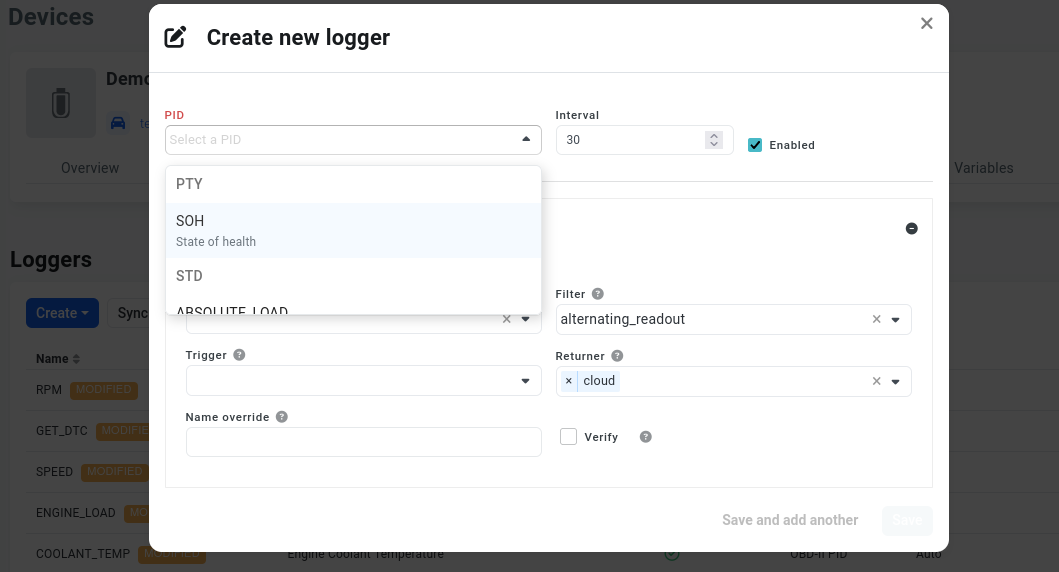
Select the PID from the list. This list includes only commands from your own library. Then set the interval (in seconds), which determines how often the logger runs. For example, 30 means the logger runs every 30 seconds.
After saving, sync changes to the device. Logging starts immediately after sync.
Step 3: Widgets - Visualize Logged Data
With logging enabled, create a widget to display the collected data on your dashboard.
Open the dashboard, click Add widget, and select a custom widget type.
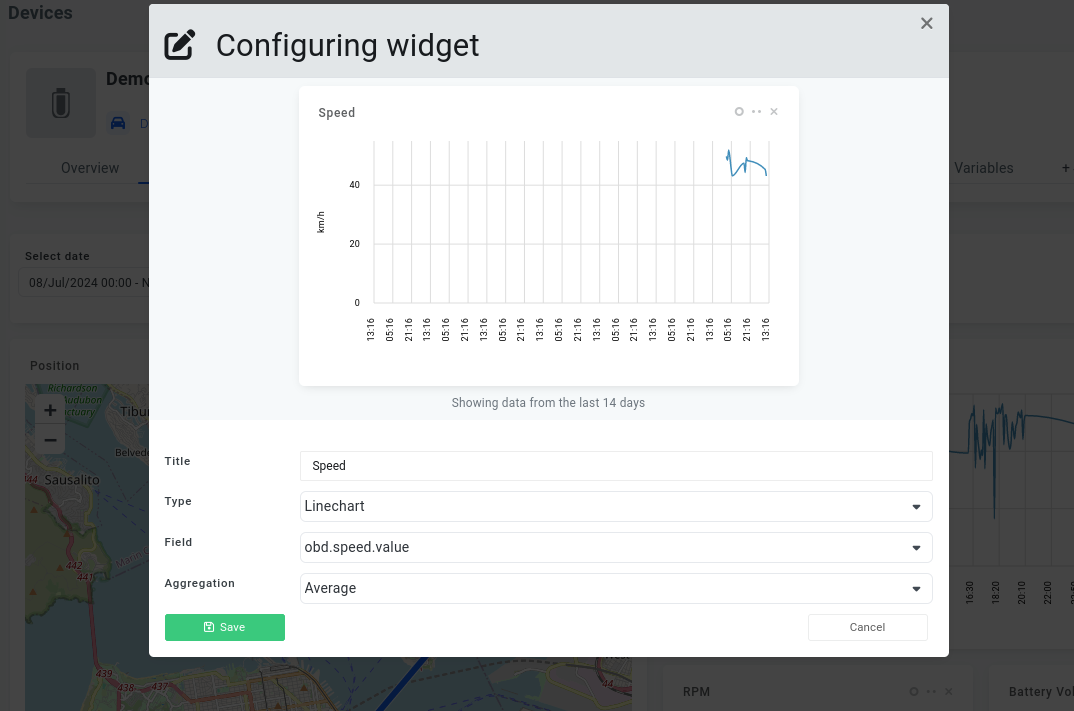
Enter a title and select a visualization type. In Field, set the data source in this format:
obd.<logger_name_lowercase>.value
For example, if your logger name is RPM, use obd.rpm.value. The widget automatically loads up to 14 days of available data.
Widgets can display only data that has already been logged. If the logger is new, data may take a short time to appear. Once the device streams data to Cloud, it becomes available for visualization across trips where that logger was used, including previously collected data.
After completing these three steps, your dashboard widget will display vehicle data from your configured OBD logger.
 Buy AutoPi device
 Compare all AutoPi devices
 Contact our sales team