Build a Grafana Dashboard Pipeline for AutoPi CAN-FD Pro Data in Amazon S3
This guide shows how to take AutoPi CAN-FD Pro logged data that is already being uploaded to Amazon S3, process it with AWS Lambda, store it in a query-friendly Parquet format, and visualize it in Grafana through Athena. AutoPi CAN-FD Pro supports output to an AWS S3 bucket, and the AutoPi REST API documentation also covers API-based export and device settings if you want to add metadata or automate parts of the setup later.
The recommended data flow is:
For high-volume CAN logging, this is a better fit than pulling bulk data through the AutoPi API. The S3 bucket should remain the primary ingestion path, while the AutoPi API is best used for optional enrichment, backfill, or automation of configuration. AWS supports invoking Lambda directly from S3 object-created events, and Grafana supports Athena as a query layer for S3-backed datasets.
1. Architecture overview
Use two S3 locations:
- A raw location for the files uploaded by the CAN-FD Pro.
- A curated location for transformed Parquet files used by Athena and Grafana.
A simple structure is:
s3://autopi-canfd-raw/
s3://autopi-canfd-curated/can_fd_parquet/
The raw bucket receives files from the device. S3 then emits an ObjectCreated event, which triggers Lambda. Lambda reads the file, normalizes the records, and writes partitioned Parquet output to the curated bucket. Athena reads the curated dataset through the Glue Data Catalog, and Grafana queries Athena. This pattern follows AWS’s standard S3-to-Lambda processing model and Grafana’s Athena integration model.
A practical partition layout is:
s3://autopi-canfd-curated/can_fd_parquet/
  device_id=<device_id>/
  channel=<channel>/
  year=<YYYY>/
  month=<MM>/
  day=<DD>/
That partitioning works well for common dashboard filters such as device, CAN channel, and time window. Parquet is the preferred format here because it is columnar and much more efficient for Athena queries than raw JSON or JSONL.
2. When to use the AutoPi API
The AutoPi API is useful, but it should not be the main path for large CAN log ingestion when the device is already writing files to S3. AutoPi’s API export guide exposes both aggregated and raw telemetry export, and AutoPi’s REST API also supports changing device settings directly, which makes it suitable for optional tasks around the pipeline rather than the pipeline itself.
Use the AutoPi API for:
- Mapping device_id, unit_id, or vehicle identifiers to human-readable names.
- Adding fleet, project, or customer metadata.
- Backfilling data if an S3 upload was missed.
- Automating device configuration so S3 logging is enabled consistently across devices.
Do not use it for:
- Continuously reading high-rate CAN logs for dashboard ingestion.
- Replacing the S3 upload path for bulk analytics data. That split keeps the pipeline simple, scalable, and aligned with the existing CAN-FD Pro setup documented by AutoPi.
Note If you want to learn more about how API works, check out this guide: Getting started with API.
3. Prerequisites
Before starting, make sure the following are in place:
- An AutoPi CAN-FD Pro already configured to log to S3.
- An AWS account with access to S3, Lambda, IAM, Glue, and Athena.
- A Grafana instance, either self-hosted or Amazon Managed Grafana.
- Sample log files from the CAN-FD Pro so you can validate the input format.
- An AutoPi API token only if you plan to use metadata enrichment or automation.
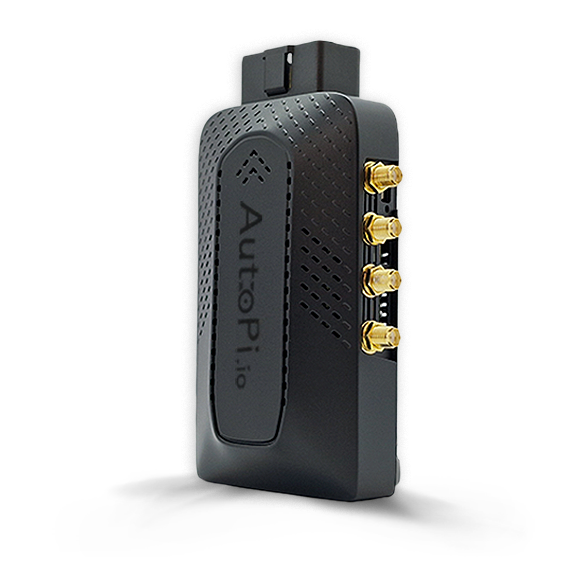
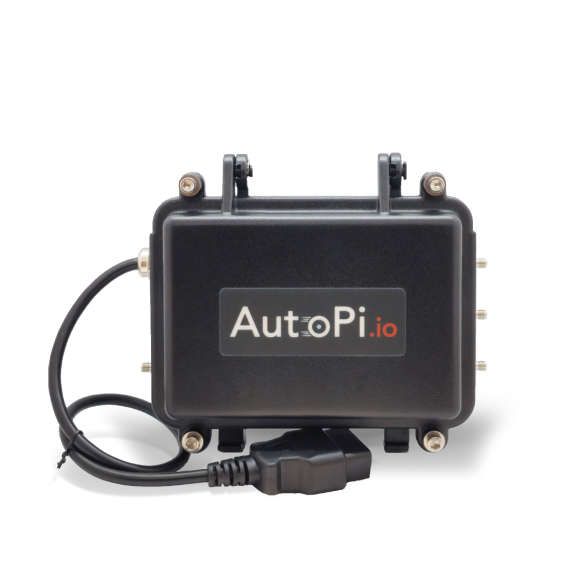
3.1 Uploading Data to AWS S3 Bucket from AutoPi CAN-FD Pro
The AutoPi CAN-FD Pro device supports two types of data logging:
- Raw data – captures everything exactly as received.
- Decoded data – data is processed and translated before storing.
By default, all data is logged and stored locally on the device. However, you can easily configure the device to upload your logged data directly to an AWS S3 bucket (both Raw data and Decoded data). Here’s how to do it:
- On your Pro device, go to: CAN Logging → Loggers.
- Create a new logger or edit an existing one.
- Navigate to Step 4: Outputs. This is where you define where the logged data should be sent. You can also read more here: Output handler configuration explained.
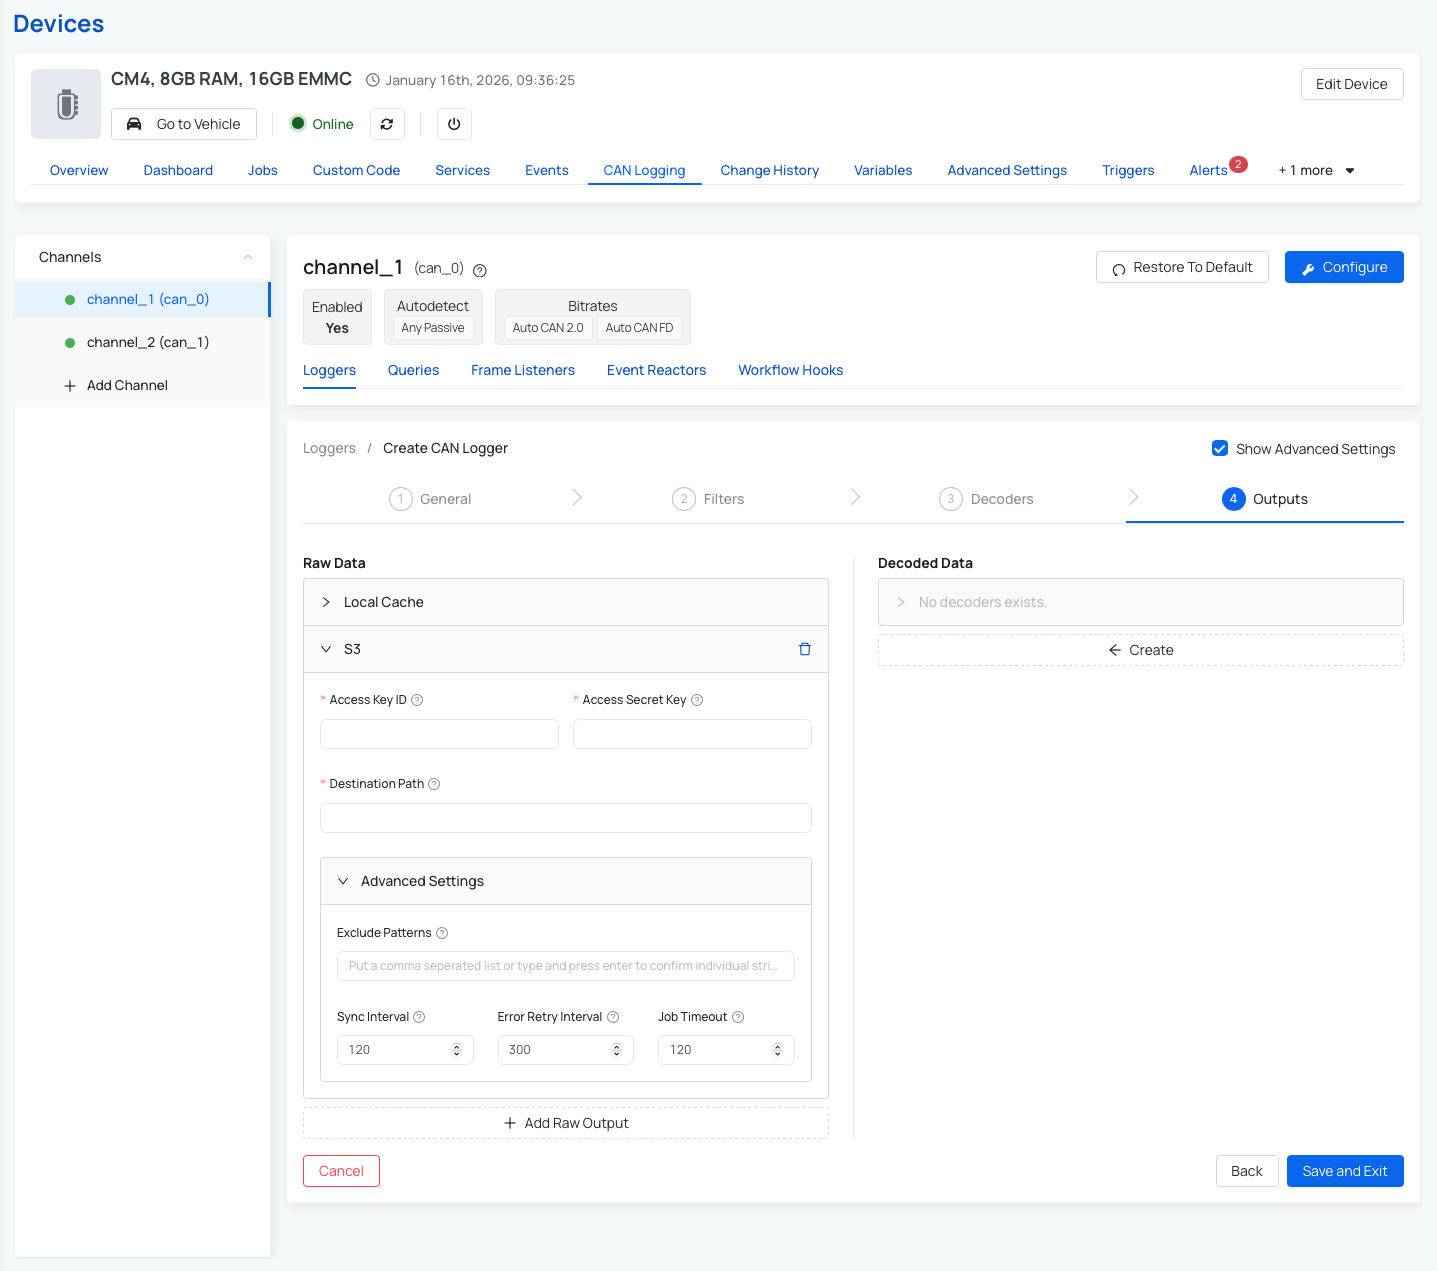
- To upload to AWS S3, fill in the following fields:
- Access Key ID – your AWS access key.
- Secret Access Key – your AWS secret key.
- Destination Path – the URL of your S3 bucket (e.g., s3://your-bucket-name/folder)
- (Optional) Configure Advanced Settings:
- Exclude Patterns – to filter out specific data
- Sync Interval – how often the device syncs data
- Error Retry Interval – wait time before retrying a failed upload
- Job Timeout – how long to wait before canceling a sync job
- Save your settings.
Once saved, your device will begin uploading data to the specified S3 bucket based on the configuration you've chosen.
Note: You can read more about advanced settings for the S3 upload process here: Advanced settings for Output Handler
3.2 AWS account with access to S3, Lambda, IAM, Glue, and Athena
Ensure that your AWS account is created and that you have access to the following services:
- Have an AWS account and ensure the IAM (Identity and Access Management) console is set up correctly.
- Setup your Amazon S3
- Setup your AWS Lambda
- Setup your AWS Glue
- Setup your Amazon Athena
3.3 A Grafana instance, either self-hosted or Amazon Managed Grafana
Browse the available Grafana features and integrations, then choose between self-hosted Grafana and Amazon Managed Grafana. You can read more here: Grafana.
3.4 Sample log files from the CAN-FD Pro so you can validate the input format
Collect at least one recent raw file and one decoded file from your S3 raw prefix. You will use these samples to verify parsing logic and schema mapping before enabling the full pipeline.
3.5 Deployment checklist before you continue
Before building Lambda and Grafana, verify these platform settings once:
- Raw and curated S3 paths are separate, and lifecycle rules are enabled for the raw bucket if you do not need long retention.
- S3 event notifications on the raw bucket are scoped to the upload prefix only.
- Athena has a query results S3 location configured (workgroup setting).
- Glue Data Catalog database exists and is in the same region as Athena/Grafana.
- Lambda timeout and memory are sized for your average file size.
- CloudWatch log retention is configured (for example 14, 30, or 90 days).
4. Configure CAN-FD Pro to upload to S3
Start by following AutoPi’s existing S3 output handler flow for the CAN-FD Pro. The device already supports sending logger output to AWS S3, so the goal here is not to invent a new upload mechanism, only to consume what the device already sends.
At this stage, validate:
- Files are arriving in the expected raw S3 prefix.
- Filenames and folder structure are predictable.
- The payload format is known: JSON, JSONL, gzip-compressed JSONL, or another file type.
- Each record includes enough context such as timestamp, device ID, channel, and message/signal content.
Before building Lambda, download one or two real sample files and inspect them. This is important because the transform logic depends on the exact structure written by the device.
5. Design the target analytics schema
Grafana works best when the data is flattened into a query-friendly table rather than left in a deeply nested raw format. For decoded signal data, a good starting schema is one row per signal value. For raw traffic analysis, you can create a second table with one row per CAN frame.
Suggested decoded signal table:
event_time          timestamp
device_id           string
unit_id             string
vehicle_id          string
channel             string
logger_type         string
message_id          string
is_extended_id      boolean
is_fd               boolean
dlc                 int
payload_hex         string
signal_name         string
signal_value_double double
signal_value_text   string
source_file         string
ingested_at         timestamp
year                string
month               string
day                 string
Suggested raw frame table:
event_time          timestamp
device_id           string
unit_id             string
vehicle_id          string
channel             string
message_id          string
is_extended_id      boolean
is_fd               boolean
dlc                 int
payload_hex         string
source_file         string
ingested_at         timestamp
year                string
month               string
day                 string
Use the decoded table for dashboards and the raw table for debugging or advanced engineering analysis. That separation keeps dashboard queries lighter and easier to maintain.
6. Create the Lambda function
The Lambda function should stay narrow in scope:
- Read the newly uploaded S3 object.
- Decompress it if needed.
- Parse and normalize the records.
- Write Parquet to the curated S3 location.
- Avoid reprocessing the same file if an event is retried.
AWS documents S3 object-created events as a standard Lambda trigger pattern.
6.1 Runtime and dependencies
Use Python 3.11 or newer if possible. For Parquet output, include:
pandaspyarrow
For larger dependencies, package them with a Lambda layer or use a container-based Lambda deployment. The code below assumes the input is JSON lines or gzip-compressed JSON lines and that the records are already either decoded or at least structured enough to normalize.
6.2 Environment variables
Create these Lambda environment variables:
CURATED_BUCKET=autopi-canfd-curatedCURATED_PREFIX=can_fd_parquet
Optional but recommended:
RAW_PREFIX=canfd/raw/(skip keys outside this prefix)MAX_RECORDS_PER_FILE=500000(guardrail for malformed files)
6.3 Lambda example
import os
import io
import json
import gzip
import boto3
import pandas as pd
from urllib.parse import unquote_plus
from datetime import datetime, timezone

s3 = boto3.client("s3")

CURATED_BUCKET = os.environ["CURATED_BUCKET"]
CURATED_PREFIX = os.environ.get("CURATED_PREFIX", "can_fd_parquet")


def read_s3_object(bucket, key):
    obj = s3.get_object(Bucket=bucket, Key=key)
    data = obj["Body"].read()

    if key.endswith(".gz"):
        data = gzip.decompress(data)

    return data.decode("utf-8")


def parse_records(text):
    rows = []

    for line in text.splitlines():
        line = line.strip()
        if not line:
            continue

        record = json.loads(line)

        ts = record.get("timestamp")
        frame = record.get("frame", {})
        signals = record.get("signals") or {}

        base = {
            "event_time": ts,
            "device_id": record.get("device_id"),
            "unit_id": record.get("unit_id"),
            "vehicle_id": record.get("vehicle_id"),
            "channel": record.get("channel"),
            "logger_type": record.get("logger_type"),
            "message_id": frame.get("id"),
            "is_extended_id": frame.get("extended"),
            "is_fd": frame.get("fd"),
            "dlc": frame.get("dlc"),
            "payload_hex": frame.get("data"),
        }

        if signals:
            for signal_name, signal_value in signals.items():
                row = dict(base)
                row["signal_name"] = signal_name
                if isinstance(signal_value, (int, float)):
                    row["signal_value_double"] = float(signal_value)
                    row["signal_value_text"] = None
                else:
                    row["signal_value_double"] = None
                    row["signal_value_text"] = str(signal_value)
                rows.append(row)
        else:
            row = dict(base)
            row["signal_name"] = None
            row["signal_value_double"] = None
            row["signal_value_text"] = None
            rows.append(row)

    return rows


def write_parquet(rows, source_bucket, source_key):
    if not rows:
        return {"rows_written": 0}

    df = pd.DataFrame(rows)
    df["event_time"] = pd.to_datetime(df["event_time"], utc=True, errors="coerce")
    df["ingested_at"] = datetime.now(timezone.utc)

    df["year"] = df["event_time"].dt.strftime("%Y")
    df["month"] = df["event_time"].dt.strftime("%m")
    df["day"] = df["event_time"].dt.strftime("%d")
    df["source_file"] = f"s3://{source_bucket}/{source_key}"

    buffer = io.BytesIO()
    df.to_parquet(buffer, index=False, engine="pyarrow")

    first = df.iloc[0]
    device_id = first.get("device_id") or "unknown-device"
    channel = first.get("channel") or "unknown-channel"
    year = first.get("year") or "unknown-year"
    month = first.get("month") or "unknown-month"
    day = first.get("day") or "unknown-day"

    out_name = source_key.split("/")[-1].rsplit(".", 1)[0] + ".parquet"
    out_key = (
        f"{CURATED_PREFIX}/"
        f"device_id={device_id}/"
        f"channel={channel}/"
        f"year={year}/month={month}/day={day}/"
        f"{out_name}"
    )

    s3.put_object(
        Bucket=CURATED_BUCKET,
        Key=out_key,
        Body=buffer.getvalue(),
        ContentType="application/octet-stream",
    )

    return {
        "rows_written": len(df),
        "output_key": out_key,
    }


def lambda_handler(event, context):
    results = []

    for record in event.get("Records", []):
        if record.get("eventSource") != "aws:s3":
            continue

        bucket = record["s3"]["bucket"]["name"]
        key = unquote_plus(record["s3"]["object"]["key"])

        if not (key.endswith(".json") or key.endswith(".jsonl") or key.endswith(".gz")):
            results.append({"skipped": key, "reason": "unsupported extension"})
            continue

        text = read_s3_object(bucket, key)
        rows = parse_records(text)
        result = write_parquet(rows, bucket, key)
        results.append({"source_key": key, **result})

    return {"results": results}
This example is intentionally simple. In production, add dead-letter handling, structured logging, schema versioning, and duplicate protection. S3 event notifications can be retried, so the function should be idempotent. AWS’s S3 and Lambda documentation is the reference point for this event-driven behavior, such as: Process Amazon S3 event notifications with Lambda.
6.4 Production hardening for Lambda
Use these production defaults so the pipeline remains stable under load:
- Enable Lambda retries with an on-failure destination (SQS or SNS) or a dead-letter queue.
- Add idempotency: store processed
bucket + key + eTagin DynamoDB and skip if already processed. - Set reserved concurrency if you need to protect downstream services.
- Log structured JSON lines with source key, row count, parse failures, and output key.
- Emit CloudWatch metrics (files processed, rows written, rows failed, duration).
7. Set up the S3 event trigger
Configure the raw bucket so that ObjectCreated events invoke the Lambda function. AWS supports Lambda directly as an S3 event destination, and the bucket notification is the standard way to do this.
Recommended settings:
- Event type:
ObjectCreated:*. - Prefix filter: the raw CAN-FD Pro upload folder only.
- Suffix filter:
.json,.jsonl, or.gzdepending on the actual file type.
Adding S3 Trigger for Lambda:
- Open the AWS Lambda console and navigate to your existing function.
- Click 'Add trigger'.
- In the trigger settings:
- Set Source to S3.
- Select the Bucket used by the logger uploads.
- Specify Suffix depending on the actual file type.
- Acknowledge the warning prompt at the bottom.
- Save the trigger configuration.
Warning: be careful not to configure the curated output prefix as a trigger source, otherwise the Lambda can trigger itself recursively when it writes Parquet back to S3. AWS explicitly warns about this kind of loop when using S3 as a Lambda trigger.
8. IAM permissions
The Lambda execution role needs permission to:
- Read objects from the raw S3 bucket.
- Write objects to the curated S3 bucket.
- Write logs to CloudWatch.
Configure Permissions through AWS Management Console (Execution Role):
- Option 1: If you are uploading for the first time, create an IAM role with the required permissions. You can read more in this guide: Create a role to delegate permissions to an AWS service
- Option 2: If you have already created a role, you can continue by selecting the existing role.
- Select 'Use an existing role'.
- Select the Existing role as 'example' from the drop-down options.
- Select 'Create function'.
If you add API enrichment, the AutoPi API call itself does not require AWS IAM, but the Lambda will need access to the secret or token stored in environment variables or AWS Secrets Manager. AutoPi’s API uses token-based authentication, so store that token securely and never hardcode it in the source.
A minimal IAM policy for S3 access would cover:
s3:GetObjecton the raw prefixs3:PutObjecton the curated prefixs3:ListBucketon both buckets if needed for checks
9. Create the Athena dataset
Once Parquet files are being written to the curated prefix, expose them to Athena through Glue. You can either use a Glue crawler or create the Athena table manually. Grafana then queries Athena rather than reading the S3 files directly. Grafana’s Athena data source documentation expects a standard Athena setup behind it. You can read more here: Amazon Athena data source for Grafana.
9.1 Example Athena table
CREATE EXTERNAL TABLE IF NOT EXISTS autopi_canfd_signals (
  event_time timestamp,
  device_id string,
  unit_id string,
  vehicle_id string,
  logger_type string,
  message_id string,
  is_extended_id boolean,
  is_fd boolean,
  dlc int,
  payload_hex string,
  signal_name string,
  signal_value_double double,
  signal_value_text string,
  source_file string,
  ingested_at timestamp
)
PARTITIONED BY (
  channel string,
  year string,
  month string,
  day string
)
STORED AS PARQUET
LOCATION 's3://autopi-canfd-curated/can_fd_parquet/';
After creating the table, either run a Glue crawler or add partitions manually. If you ingest data continuously, configure partition discovery as part of the workflow so new data becomes queryable without manual intervention. Athena and Glue are designed for this S3-plus-catalog pattern.
9.2 Partition refresh and smoke test
If you are not using a crawler, run partition discovery after new data arrives:
MSCK REPAIR TABLE autopi_canfd_signals;
Then run a quick validation query:
SELECT count(*) AS rows_total
FROM autopi_canfd_signals
WHERE year = date_format(current_date, '%Y')
  AND month = date_format(current_date, '%m');
If this query returns rows, Athena can see your curated data and partitions.
10. Connect Grafana to Athena
The Amazon Athena data source plugin allows you to query and visualize Amazon Athena data metrics from within Grafana.
Step 1: Prepare Athena query output and workgroup
- In Athena, create or select a workgroup for Grafana.
- Configure an S3 output location for Athena query results.
- Confirm Grafana credentials/role can write to this output location.
Step 2: Add Athena as a data source in Grafana
- Open Grafana.
- Go to Connections → Data Sources.
- Click "Add new data source" button in the top right corner.
- Search for Amazon Athena plugin.
- Install Amazon Athena plugin. You can also follow the installation steps in this guide.
Step 3: Configure authentication for Grafana Recommended for Amazon Managed Grafana:
- Use IAM role-based access (workspace role or assumed role), not long-lived access keys.
For self-hosted Grafana, if you use IAM user credentials:
- Open the AWS IAM Console.
- Go to Users → click Create User.
- Enter a username and click Next.
- For permissions, choose Attach policies directly.
- Select the required Athena and S3 access policies.
- Click Create user.
- Copy or download the Access Key ID and Secret Access Key and store them securely.
- Click Done.
Step 4: Configure Athena plugin in Grafana
- In Grafana, open the Athena data source you added and go to settings.
- Configure authentication based on your setup:
- Amazon Managed Grafana: select IAM role/assume-role settings.
- Self-hosted Grafana with IAM user: enter Access Key ID and Secret Key.
- Fill in the following settings:
- Default Region (where your S3 bucket and Athena DB are).
- Catalog (typically
AwsDataCatalog). - Workgroup.
- Database (Athena DB containing your tables).
- Output location: S3 bucket folder for query results.
- Click Save & Test and confirm the data source connects successfully.
Step 5: Build a dashboard in Grafana
- Go to Dashboards → New → New Dashboard.
- Click Add visualization.
- Select your Athena data source.
- In the query editor, write your SQL query.
- Click Run query to preview results.
- Adjust the panel visualization (graph, table, etc.) based on your preferences.
Step 6: Save and use
- Save the panel and add more panels as needed.
- Save the dashboard.
- Setup is complete. Your Grafana dashboard now pulls data from AWS Athena.
For Amazon Managed Grafana, AWS also documents A guided Athena connection flow. For self-hosted Grafana, use the Athena data source plugin and Standard AWS credentials or IAM role configuration.
Example Grafana queries
Time series of a decoded signal:
SELECT
  event_time AS time,
  signal_value_double AS value,
  device_id
FROM autopi_canfd_signals
WHERE signal_name = 'VehicleSpeed'
  AND device_id = '${device_id}'
  AND channel = 'can0'
  AND $__timeFilter(event_time)
ORDER BY event_time
Last known value per signal:
SELECT
  signal_name,
  max_by(signal_value_double, event_time) AS latest_value,
  max(event_time) AS latest_ts
FROM autopi_canfd_signals
WHERE device_id = '${device_id}'
  AND $__timeFilter(event_time)
GROUP BY signal_name
ORDER BY signal_name
Signal count per minute:
SELECT
  date_trunc('minute', event_time) AS time,
  count(*) AS value
FROM autopi_canfd_signals
WHERE device_id = '${device_id}'
  AND $__timeFilter(event_time)
GROUP BY 1
ORDER BY 1
Grafana’s Athena integration supports SQL queries and time filter macros for dashboard use.
11. Optional AutoPi API enrichment
If the raw log files do not contain enough business context, enrich the data in one of two ways:
- Call the AutoPi API from Lambda at ingest time.
- Run a separate periodic metadata sync job and join on device_id in Athena.
The second option is usually cleaner. It avoids adding API latency and possible rate-limit pressure to the ingest path. AutoPi’s API documentation confirms that data export and device management endpoints are available, which makes a scheduled metadata sync practical.
A simple pattern is:
- Nightly job fetches device and vehicle metadata from AutoPi.
- Writes a small metadata table to S3 as Parquet.
- Athena joins telemetry data with metadata table in Grafana queries.
This keeps the Lambda function focused on file transformation and avoids coupling the main ingest path to an external API call for every uploaded log file.
12. Performance recommendations for high-volume logging
For high-volume CAN data, the most important design choices are around query efficiency rather than just ingestion. Athena charges by data scanned, and Grafana panel performance depends heavily on how much data each query needs to read.
Warning: The Athena/Grafana approach is strong, but only if the dataset is curated properly.
Recommended practices:
- Write Parquet, not JSON, to the analytics bucket.
- Partition by device, channel and date.
- Keep one curated table for decoded signals and another for raw frames.
- Downsample or pre-aggregate extremely high-rate signals if the dashboard only needs overview metrics.
- Keep the AutoPi API out of the core ingest loop.
- Use prefix filters on S3 event notifications so Lambda only processes relevant files.
- Make the Lambda function idempotent to handle retries safely.
AWS’s S3 event and Lambda model supports this event-driven pipeline well, while Grafana and Athena are suited to curated analytical datasets rather than arbitrary raw log dumps.
13. Troubleshooting
Lambda is not triggered Check the S3 bucket notification configuration, the event type, and the Lambda resource-based permission that allows S3 to invoke the function. Recommendation: AWS documents both the event notification setup and the Lambda S3 trigger requirements.
Athena table shows no rows Confirm the Parquet files are being written to the same S3 prefix referenced by the table and that partitions have been added or crawled. Athena depends on the table location and partition metadata being correct.
Grafana queries are slow Check whether the query filters on partition columns such as device_id, channel, year, month, and day. If not, Athena will scan far more data than needed. Using Parquet and proper partitions is the main fix.
Grafana says "AccessDenied" or "Unable to verify/create output bucket" Check that Grafana's AWS identity can run Athena queries, access Glue metadata, and write to the Athena query result S3 path. Also verify the selected Athena workgroup and region match your dataset.
Input format does not match the Lambda parser Download a real sample file from the raw bucket and adapt the parser to the exact structure. The provided Lambda code is a starting point, not a guarantee of a perfect match to every logger output format. Our CAN logging guide is the right reference point for understanding what the device produces.
14. Summary
The simplest and most scalable way to build Grafana dashboards for AutoPi CAN-FD Pro log data is to keep the device’s existing S3 upload path, add an S3-triggered Lambda transform step, write partitioned Parquet for Athena, and connect Grafana to Athena.
AutoPi already supports S3 output for CAN-FD Pro, AWS supports direct S3-to-Lambda event processing, and Grafana supports Athena as a data source. The AutoPi API is useful for enrichment and automation, but it should stay optional rather than becoming the main ingestion path for large logging volumes.
15. End-to-end validation checklist
Use this final checklist before sharing dashboards with other users:
- Device uploads a new CAN log file to the raw S3 prefix.
- Lambda is invoked and writes a Parquet object to the curated prefix.
- Glue/Athena can discover the new partition.
- Athena test query returns rows for expected device/channel/date filters.
- Grafana Athena data source passes "Save & Test".
- At least one panel renders values over time and updates with new data.
- CloudWatch shows no repeated parse or permission errors.
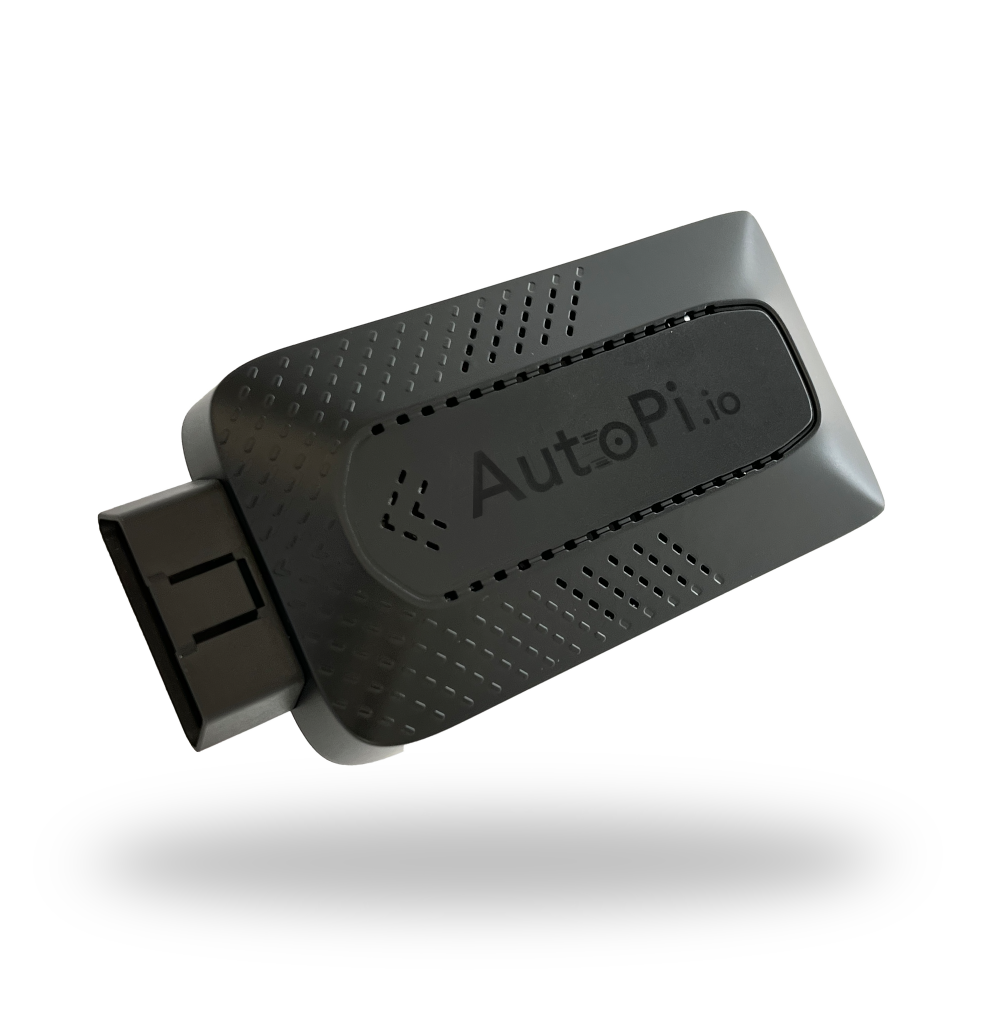 Buy AutoPi device
 Compare all AutoPi devices
 Contact our sales team