Vehicle Details
The Vehicle Details section of AutoPi Cloud centralizes all key information about your vehicles in one place. It provides general vehicle data, real-time widget displays, trip history, active alerts, and diagnostic codes — giving you the tools you need to efficiently manage your fleet and maintain operational performance.
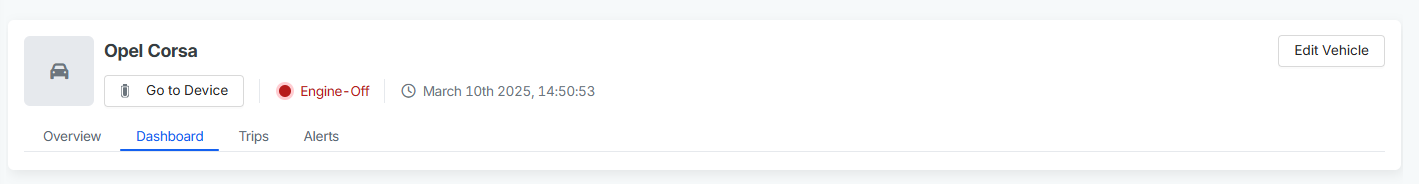
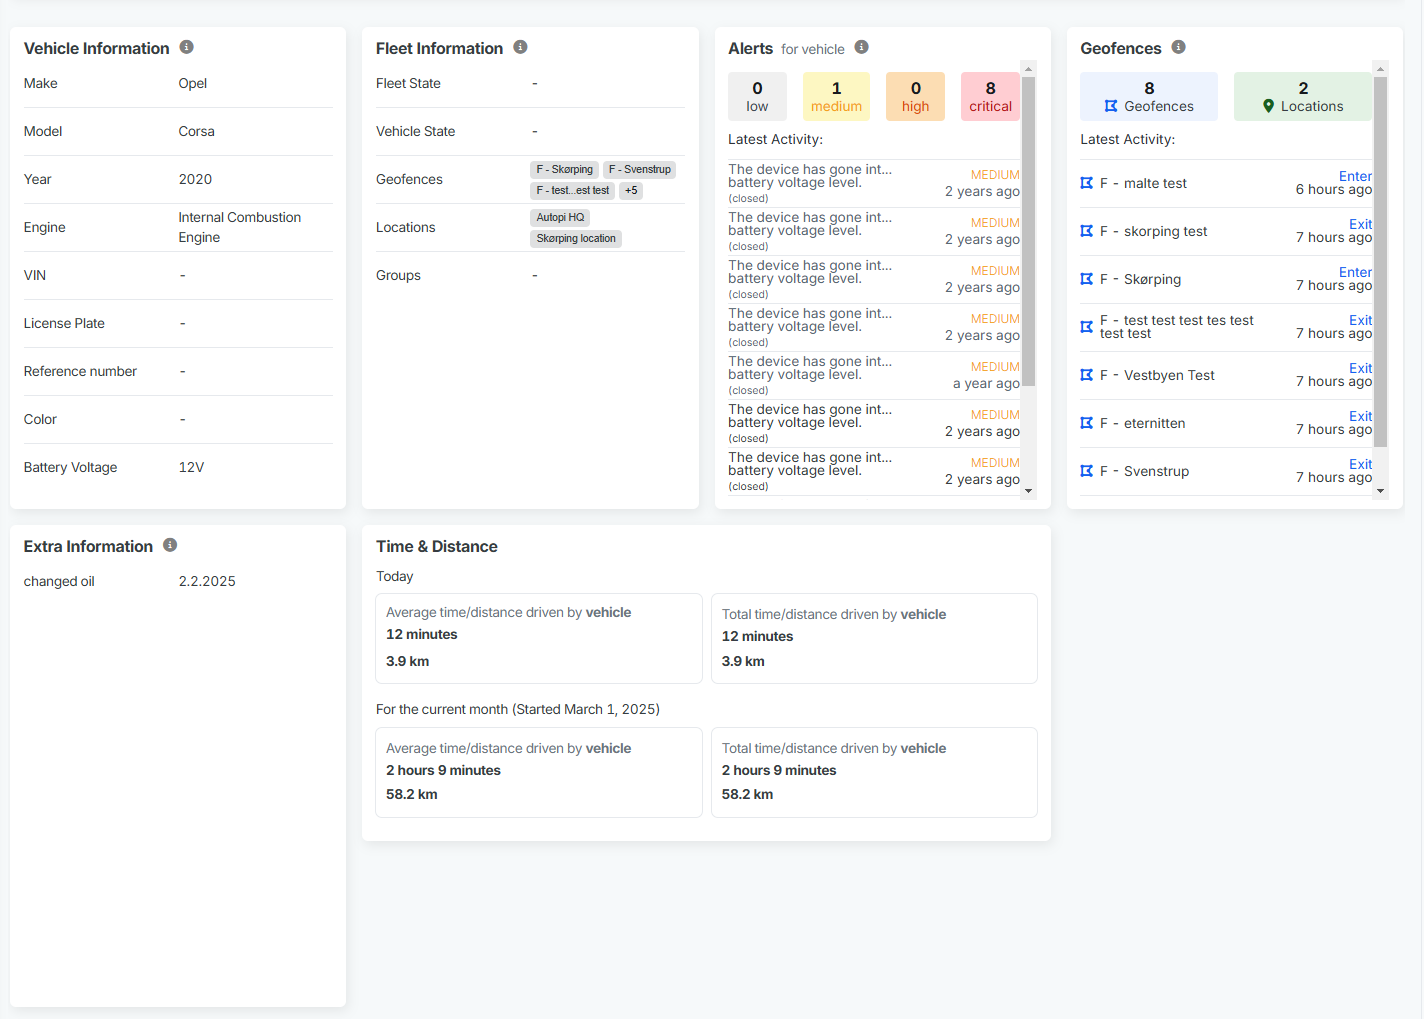
Overview
The Overview section presents a summary of key vehicle information through a series of widgets. Here you can find details about the vehicle itself, the fleet it belongs to, active alerts, assigned geofences, and location data. It also displays cumulative statistics on time driven and total distance traveled.
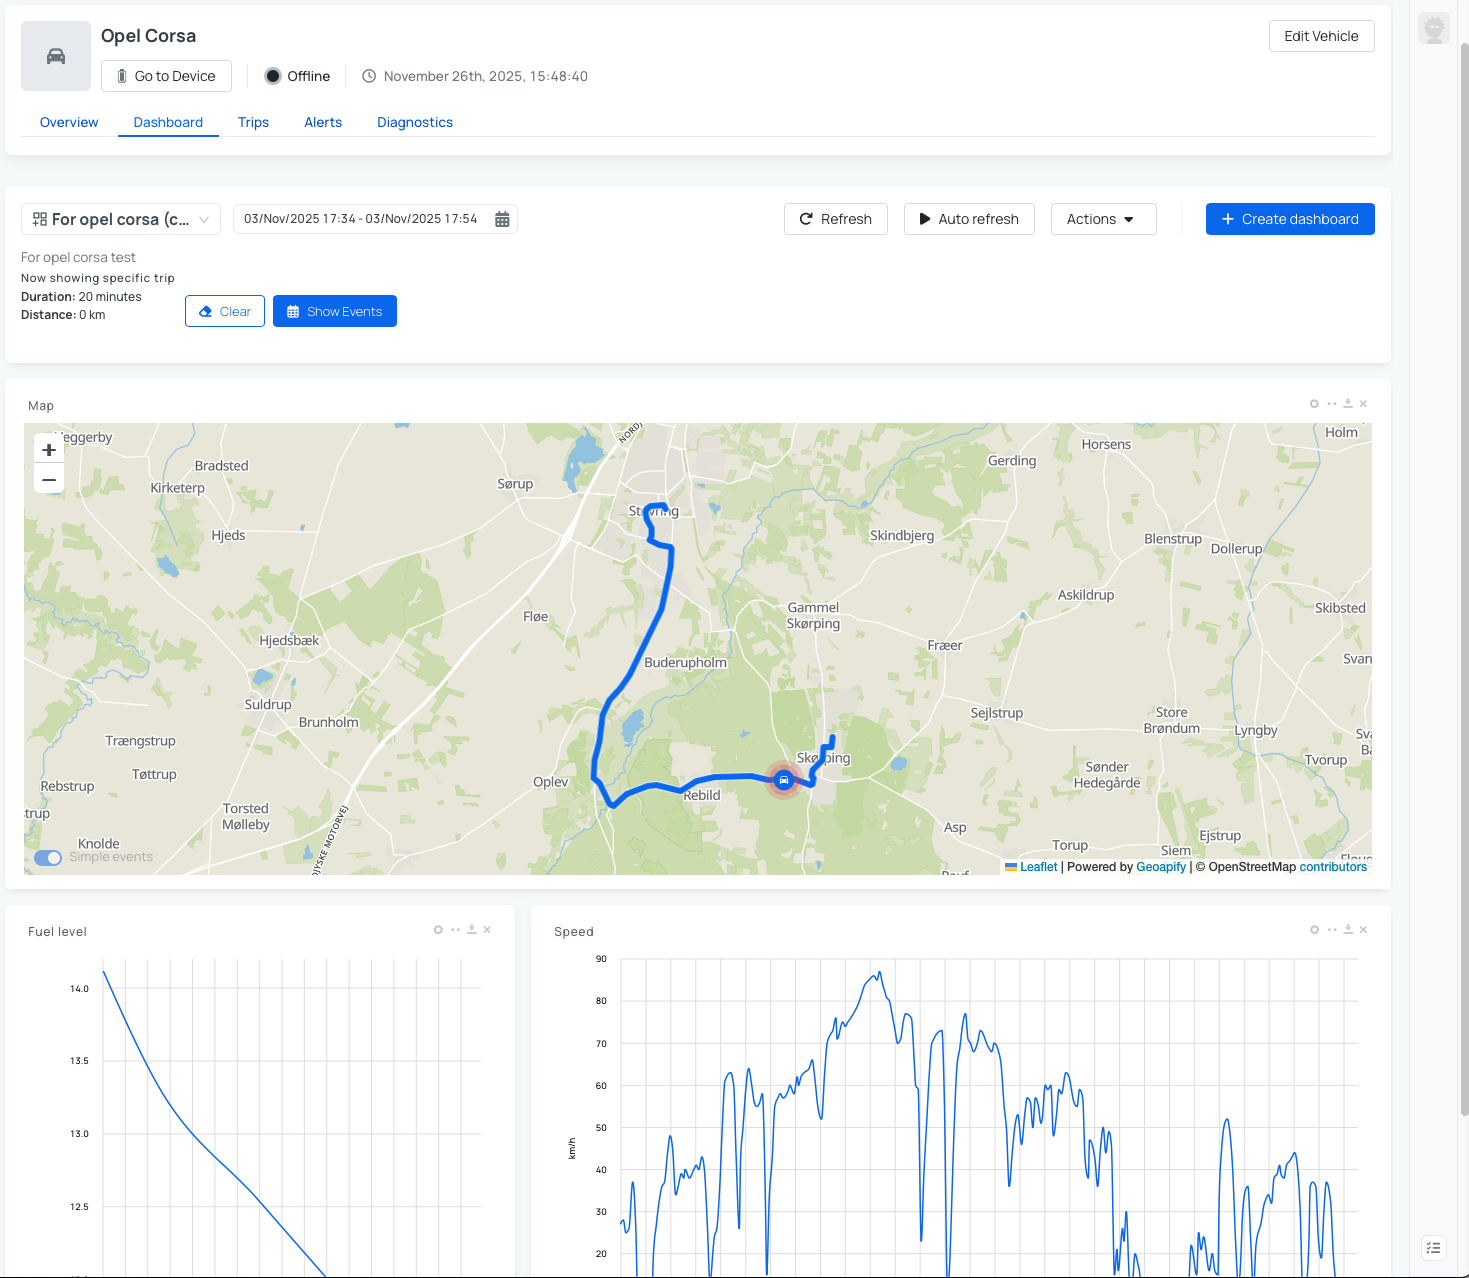
Dashboard
The Dashboard section offers a visual representation of real-time vehicle data. Data can be displayed in a variety of widget formats to suit your monitoring needs:
- Line chart
- Area chart
- Map
- Gauge
- Bar chart
- Pie chart
- State timeline
- Linear gauge
- Numeric
You can filter data by date range to track metrics such as vehicle position, speed, RPM, and more. Widgets are fully customizable — build your own to surface the data that matters most, or use the Auto Generate feature to have the platform automatically create a dashboard based on the latest data received from the vehicle.
The platform supports multiple dashboards, so you can create and organize as many as needed. Dashboards are grouped into three categories:
- Autogenerated — automatically created based on data received from the device
- Mine — dashboards you have created manually
- Shared — dashboards shared by an admin user within your organization
Users with Admin permissions can create dashboards and push them to specific vehicles based on vehicle type or Make/Model. You can read more here: Shared Dashboards.
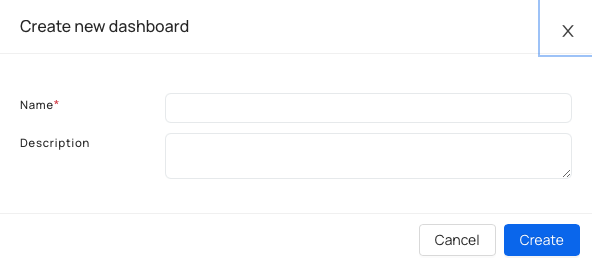
Create New Dashboard
To create a new Vehicle dashboard:
- Navigate to Vehicle> Dashboard.
- Click Create dashboard.
- Enter:
- Name: A clear dashboard name.
- Description (optional): A short description of its purpose.
- Click Create.
Adding Widgets to the Dashboard
Use real vehicle data when possible to validate widget configuration.
The Autogenerate option creates widgets automatically from available device data. This is a practical starting point when creating a dashboard from scratch.
To add a widget manually:
- Navigate to the Dashboard and click Actions.
- Click Add widget.
- Select a widget type.
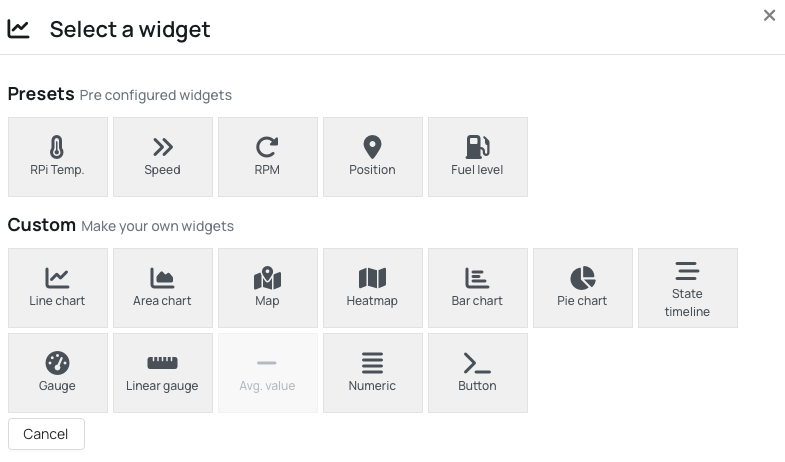
- Configure the widget:
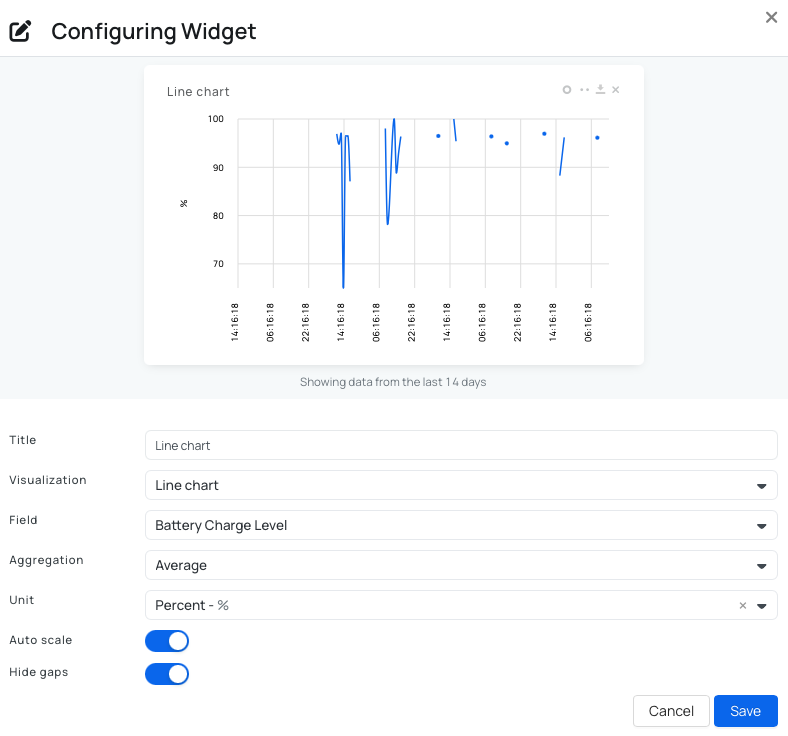
- Title: Widget display name.
- Visualization: Chart or display type (line chart, map, gauge, and so on).
- Field: Logger or signal to display.
- Aggregation: Average, minimum, maximum, sum, or raw data.
- Unit: Unit shown in the widget.
- Auto scale: Scales values automatically to fit the visualization.
- Hide gaps: Shows or hides periods with no data.
- Click Save in the widget editor, then save the dashboard.
Widget Controls
Each widget has the following controls in the top-right corner:
| Icon | Action |
|---|---|
| Circle (refresh) | Refresh the data displayed in the widget |
| Two-dot (edit) | Open the widget editor |
| Download | Download the data for this widget only |
| X (delete) | Remove the widget from the dashboard |
Trips
Next to Dashboard you’ll find the Trips section. This section provides detailed information about the vehicle’s trips, displaying the trip route on a map along with the starting and ending addresses, duration, and distance traveled. You can also categorize trips as personal or business and, if necessary, export trip data.
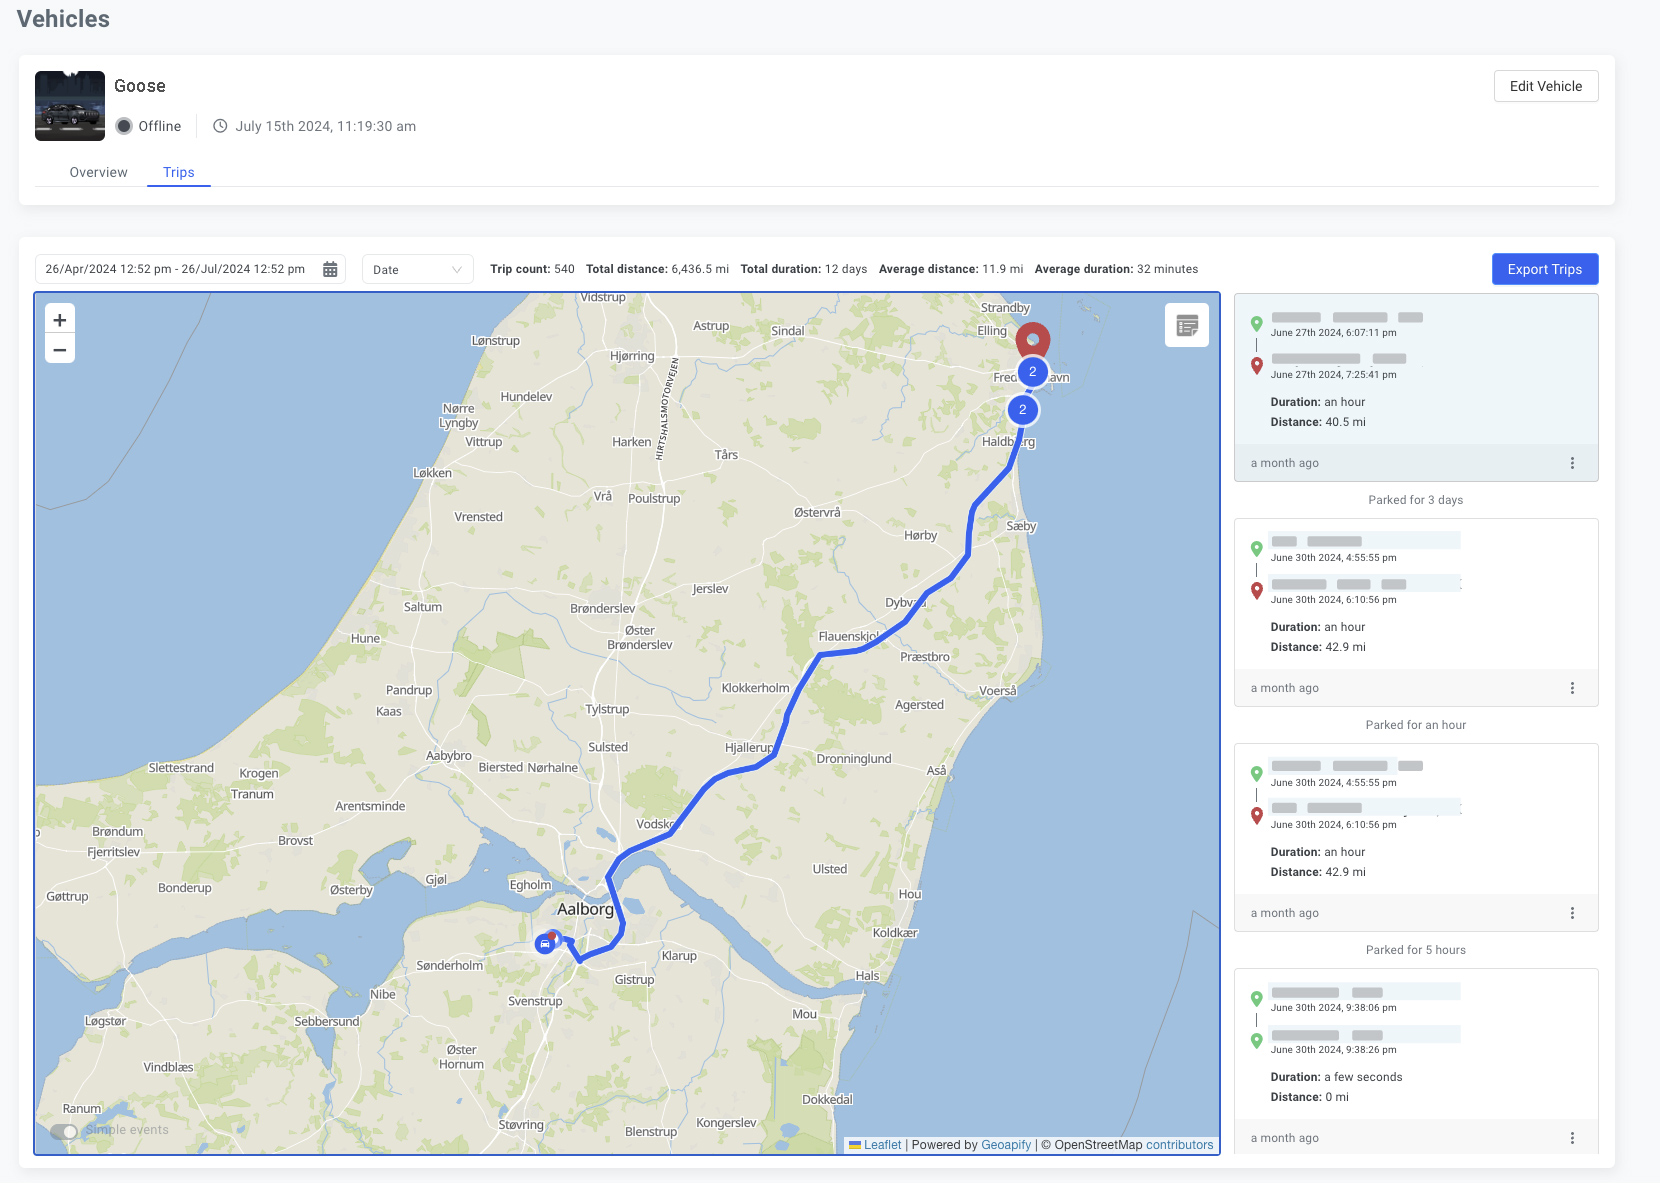
Above the map, you have filtering options for the trips, choose a week, last month or a custom range you would like to view, and it will show you a list of all the trips that have been taken by this vehicle during the filtered time. Clicking on one of the trips will show you a route on the map, the distance it travelled and how long the trip took.
You can further filter the trip view based on the date or number of months, as well as by distance or duration of the trips. Next to the filtering options, you will see overall data of this vehicle’s trips, including the total number of trips made, total distance driven, total duration, and average distance and duration.
Alerts
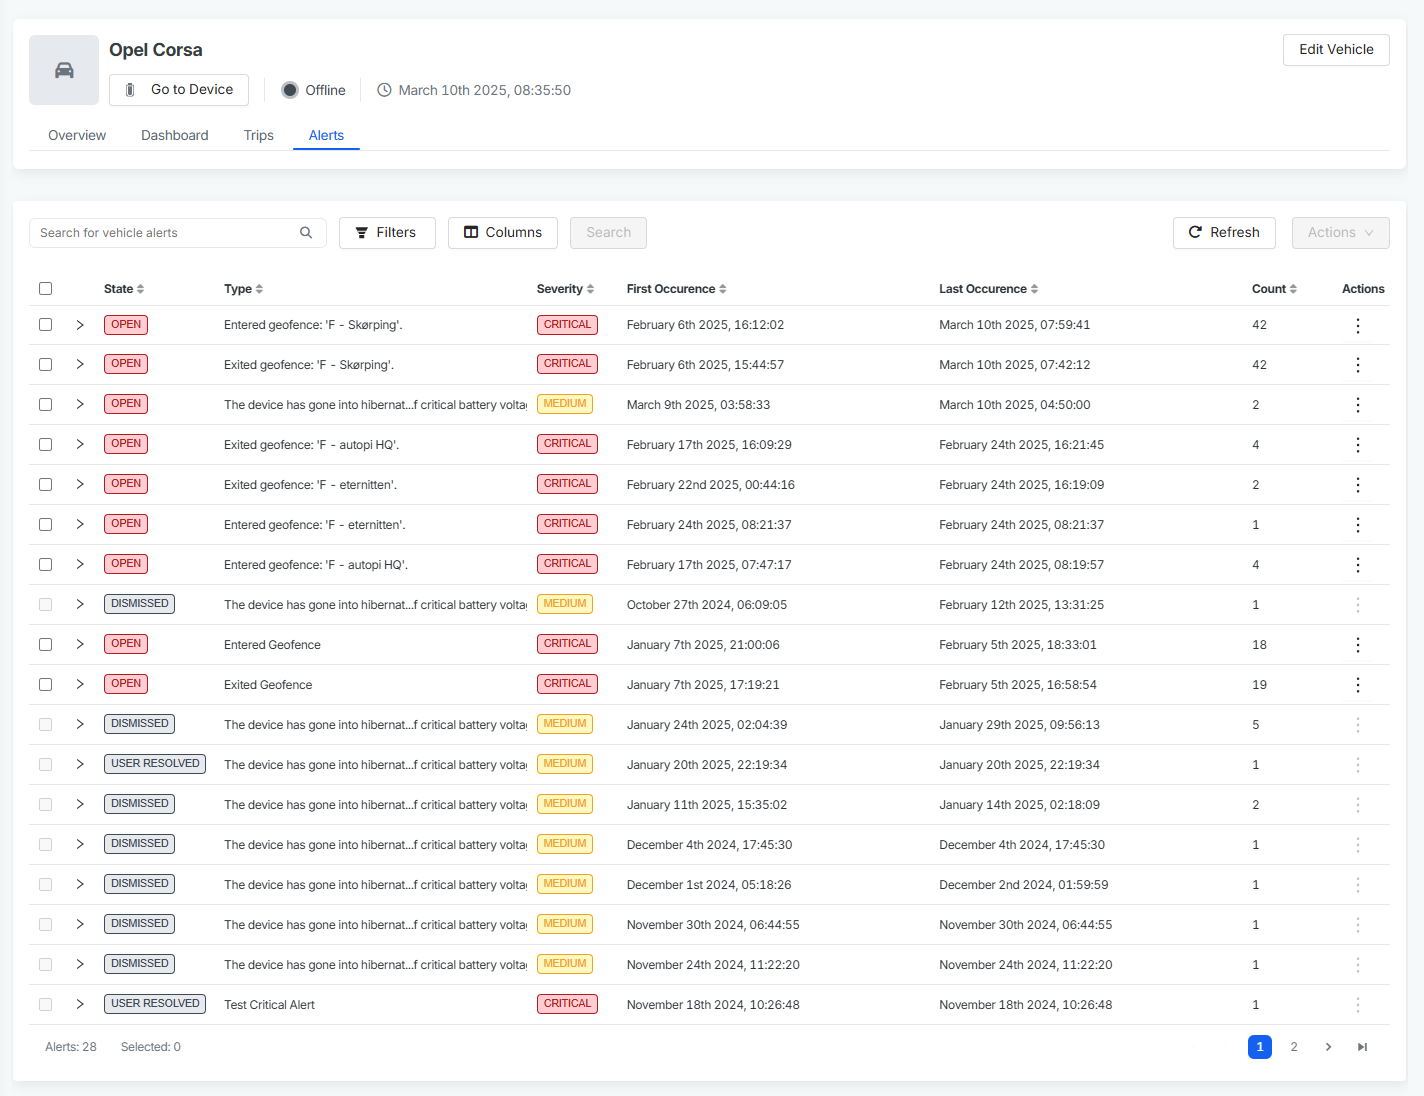
The Alerts tab displays all active alerts associated with the vehicle. The table lists each alert's severity level, occurrence count, and description, giving you a clear view of any issues requiring attention. Alerts can be dismissed or resolved directly from this view.
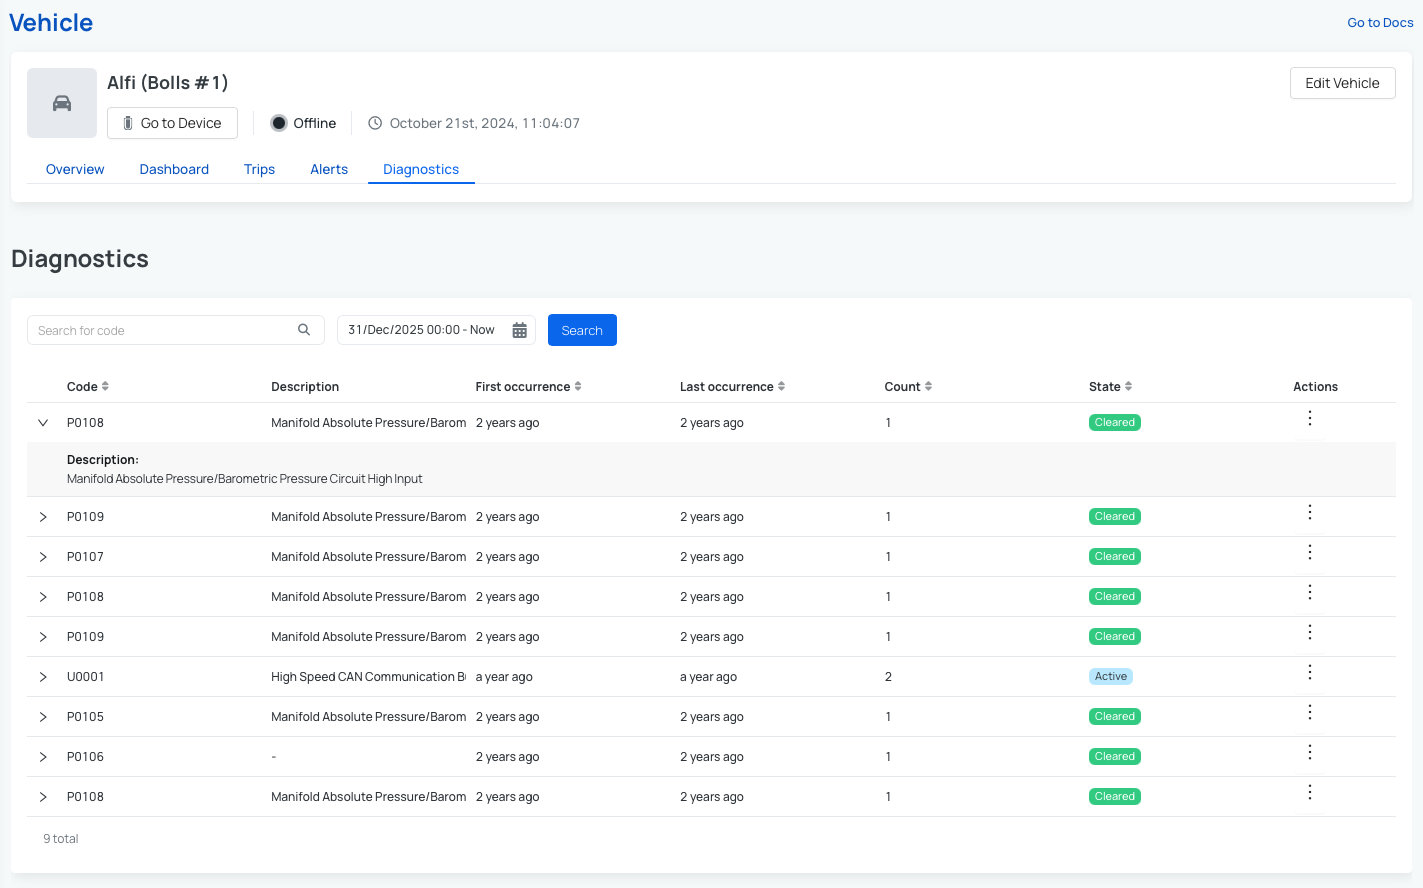
Diagnostics
The Diagnostics tab is the final section of the Vehicle view. It lists all diagnostic error codes currently reported by the vehicle, providing structured insight into any detected issues.
For each diagnostic code, the following information is available:
- The error code and its description
- Timestamps for the first and last occurrence
- A count of how many times the error has been recorded
This gives you a clear picture of not only what the issue is, but also when it first appeared and how frequently it recurs. When used alongside the Fault Codes functionality, the Diagnostics tab becomes a powerful real-time monitoring tool. Critical issues can trigger immediate notifications via cloud alerts or email, allowing your team to respond promptly. You can also configure a custom Trigger to automate actions based on any specific diagnostic code.
 Buy AutoPi device
 Compare all AutoPi devices
 Contact our sales team