Vehicle Details
This section of AutoPi Cloud provides all the essential information about your vehicles. It includes general details displayed on the dashboard, widgets with real-time data from your vehicle, trip history, and important alerts to monitor. These vehicle insights are designed to help you manage your fleet more effectively and optimize its efficiency.
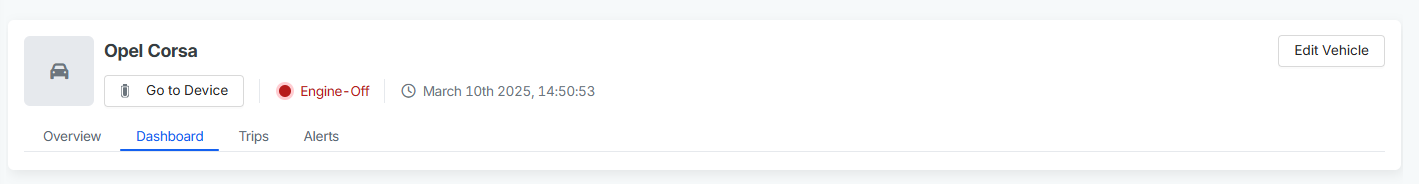
Overview
In the vehicle Overview section, you will see different widgets with information about the vehicle, the fleet it is assigned to, the vehicle’s open alerts, geofences, and locations. You can also view data about the time and distance the vehicle has driven.
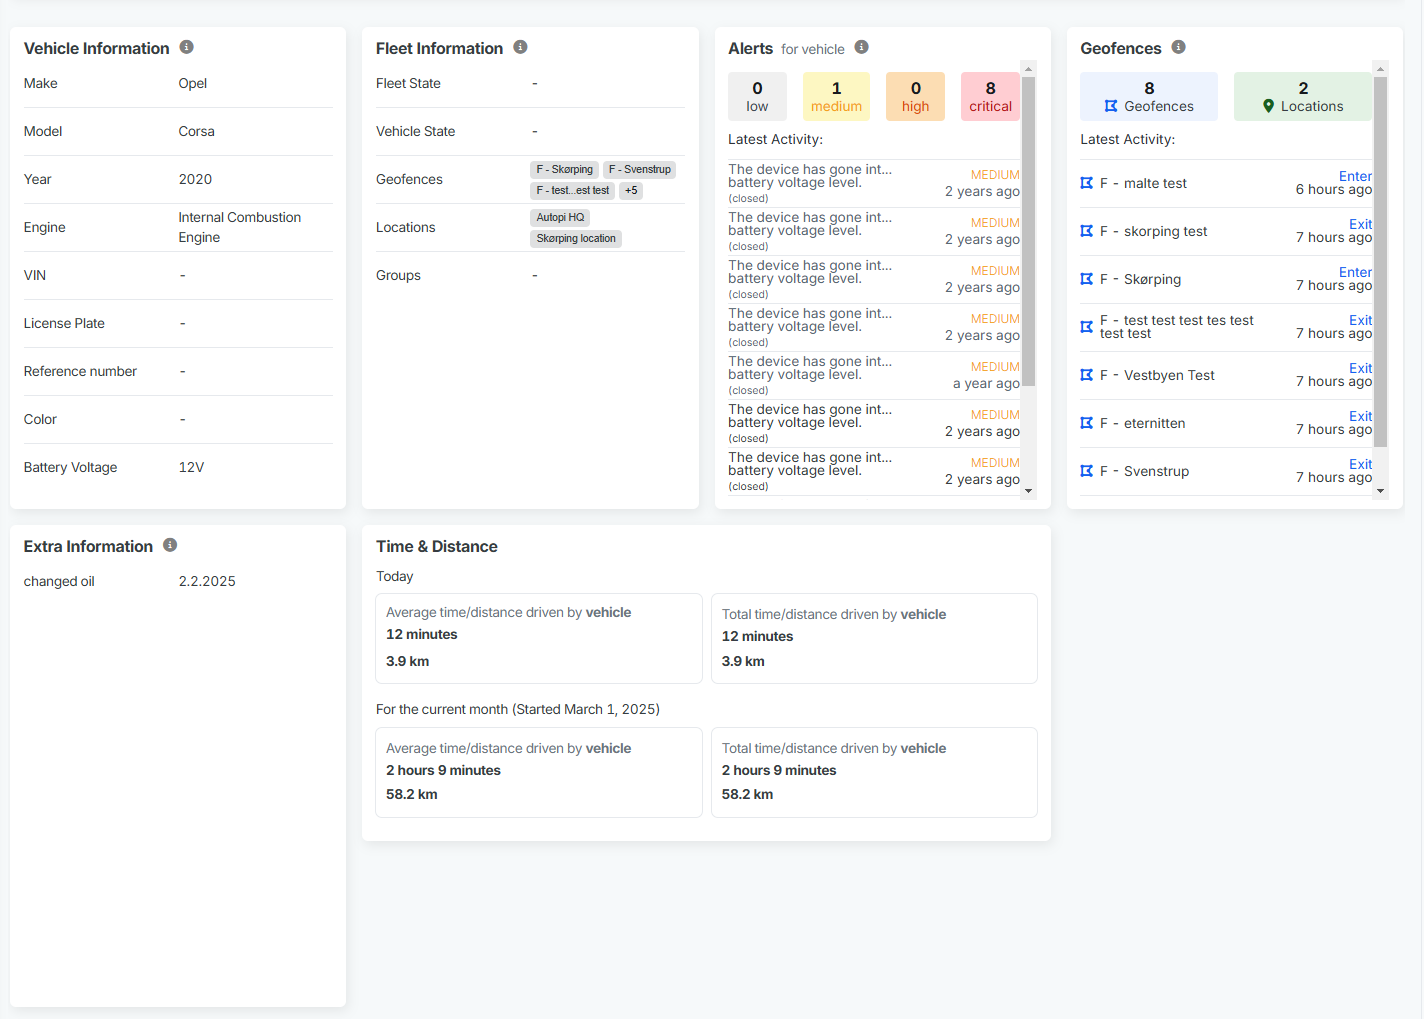
Dashboard
Vehicle's Dashboard section, provides you with a visual representation of real-time data for your vehicle. You can choose to view data in various formats:
- Line chart
- Area chart
- Map
- Gauge
- Bar chart
- Pie chart
- State timeline
- Linear gauge
- Numeric
The dashboard allows you to filter data by date, enabling you to monitor the vehicle's position, speed, RPM and many more. You are able to create a custom widgets based on the data you want to receive. You can also use our functionality "Auto Generate" where our platform generates the dashboard with widgets for you based on the latest data received from the vehicle. Our platform also support Multiple dashboards view and therefore you can add as many dashboards as desired.
We have a 3 types of dashboards:
- Autogenerated - this dashboard is generated based on the data received from the device
- Mine - dashboards that user creates himself
- Shared - dashboards that were shared from your admin user under your customer
If you have Admin permission, you are also able to create a dashboard and push them to different vehicles based on their type or Make/Model.
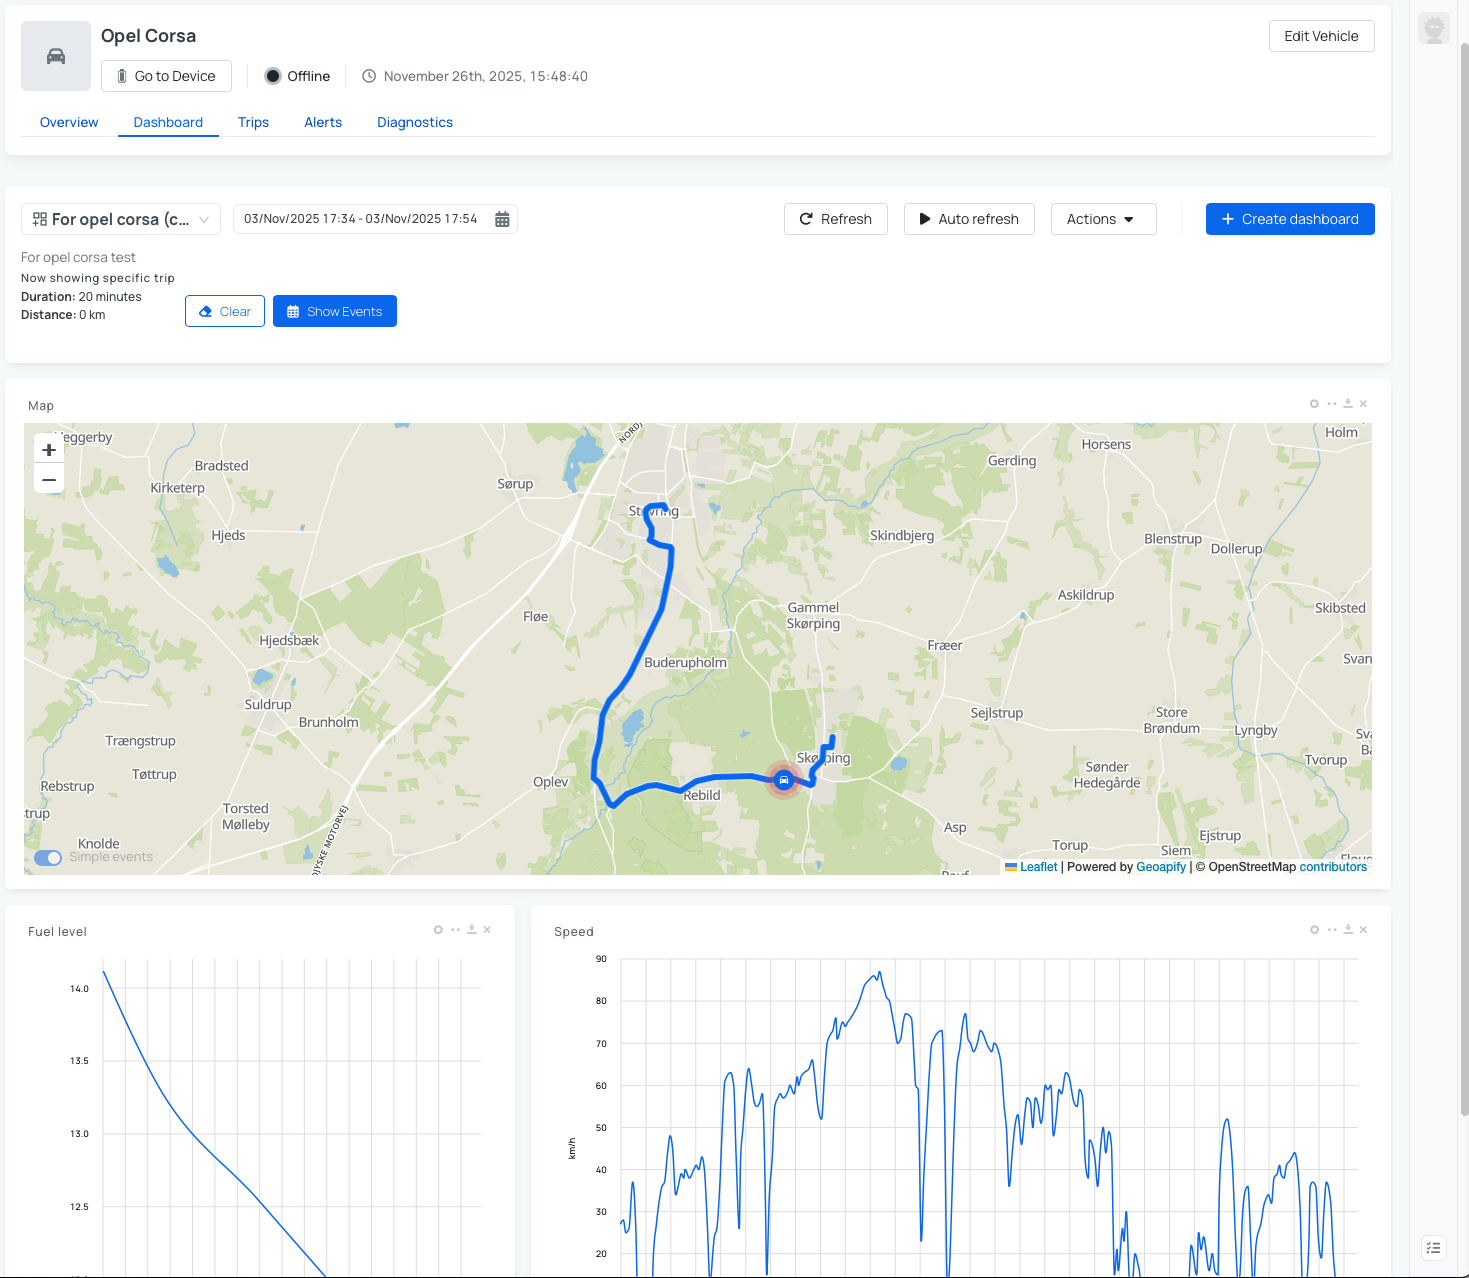
Trips
Next to Dashboard you’ll find the Trips section. This section provides detailed information about the vehicle’s trips, displaying the trip route on a map along with the starting and ending addresses, duration, and distance traveled. You can also categorize trips as personal or business and, if necessary, export trip data.
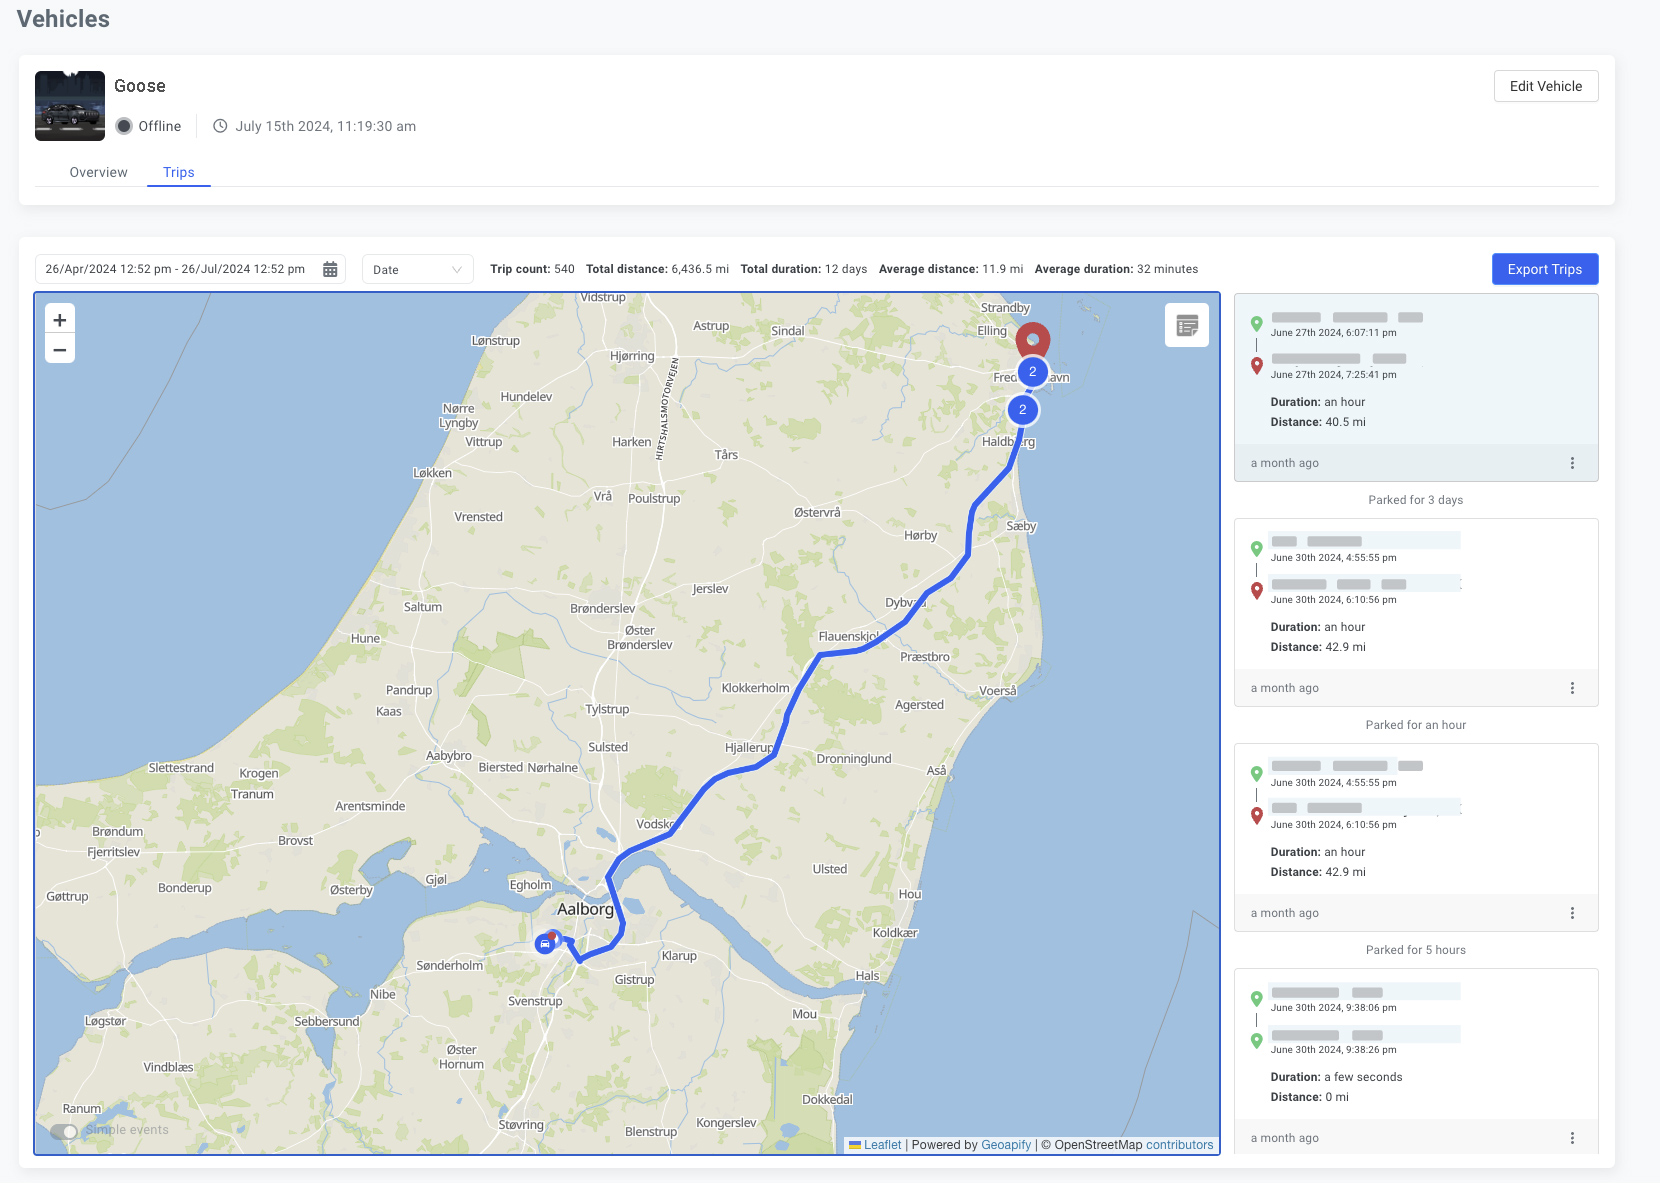
Above the map, you have filtering options for the trips, choose a week, last month or a custom range you would like to view, and it will show you a list of all the trips that have been taken by this vehicle during the filtered time. Clicking on one of the trips will show you a route on the map, the distance it travelled and how long the trip took.
You can further filter the trip view based on the date or number of months, as well as by distance or duration of the trips. Next to the filtering options, you will see overall data of this vehicle’s trips, including the total number of trips made, total distance driven, total duration, and average distance and duration.
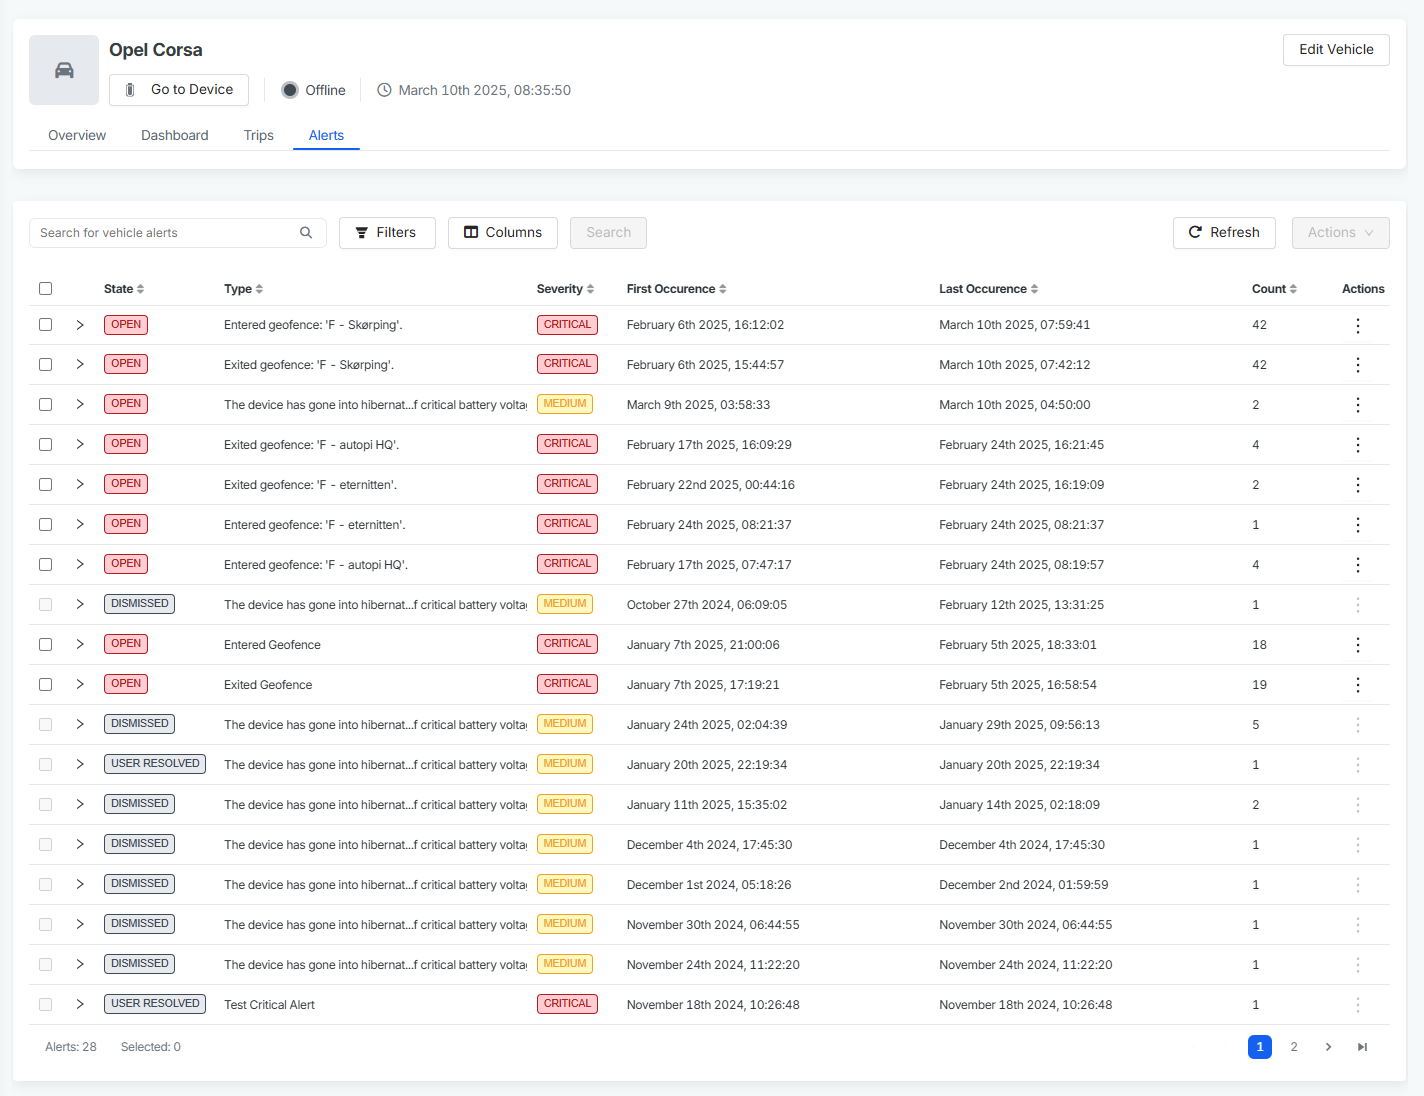
Alerts
Next tab represents Alerts. This section displays all important alerts related to your vehicle. You can view their severity, count, and description in the table. Additionally, you have the option to dismiss or resolve them as needed.
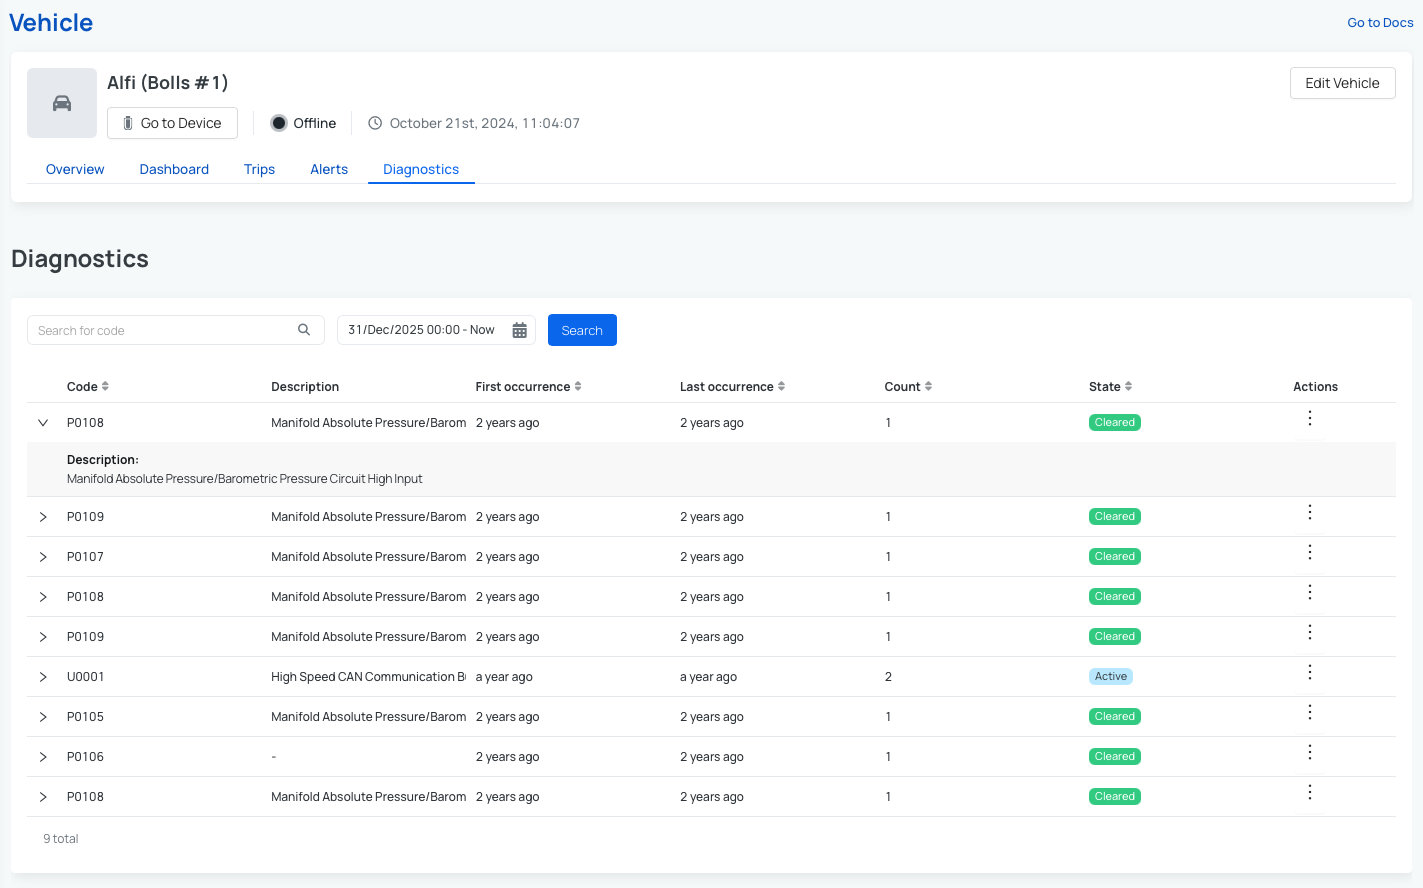
Diagnostics
The Diagnostics tab is the last section under the Vehicle view. It displays all diagnostic error codes currently reported by the vehicle.
For each diagnostic code, you can see:
- The error code itself with description.
- The first and last occurrence timestamps.
- Count of how many times the error has occurred.
This allows you to understand not only what the issue is, but also when it started and how frequently it appears. When combined with the Fault Codes functionality, the Diagnostics page becomes a powerful tool for real-time monitoring. You can be alerted about critical issues immediately either through cloud notifications or email alerts, so you can react quickly to vehicle problems. Additionaly you can create a custom Trigger to perform an action based on any specified code.
 Buy AutoPi device
 Compare all AutoPi devices
 Contact our sales team