Data Troubleshooting
If you've completed the Getting Started Guide and tested your AutoPi TMU CM4 device during a drive but aren't seeing data on the AutoPi Cloud Dashboard, this guide will help you identify and resolve the issue systematically.
What You'll Learn
By following this guide, you will:
- Check device LED status and verify cloud connectivity.
- Diagnose and resolve internet connectivity issues.
- Verify and configure CAN Bus settings for your vehicle.
- Create and configure Loggers to capture vehicle data.
- Set up and customize dashboard widgets to display your data.
- Troubleshoot widget configuration issues.
Common Causes and Solutions
This guide is organized by cause, detailing potential reasons why vehicle data may not appear on the AutoPi Cloud Dashboard. It is intended for the AutoPi TMU CM4 device. For the AutoPi Mini, please refer to the Mini guides.
1. Connection Issues
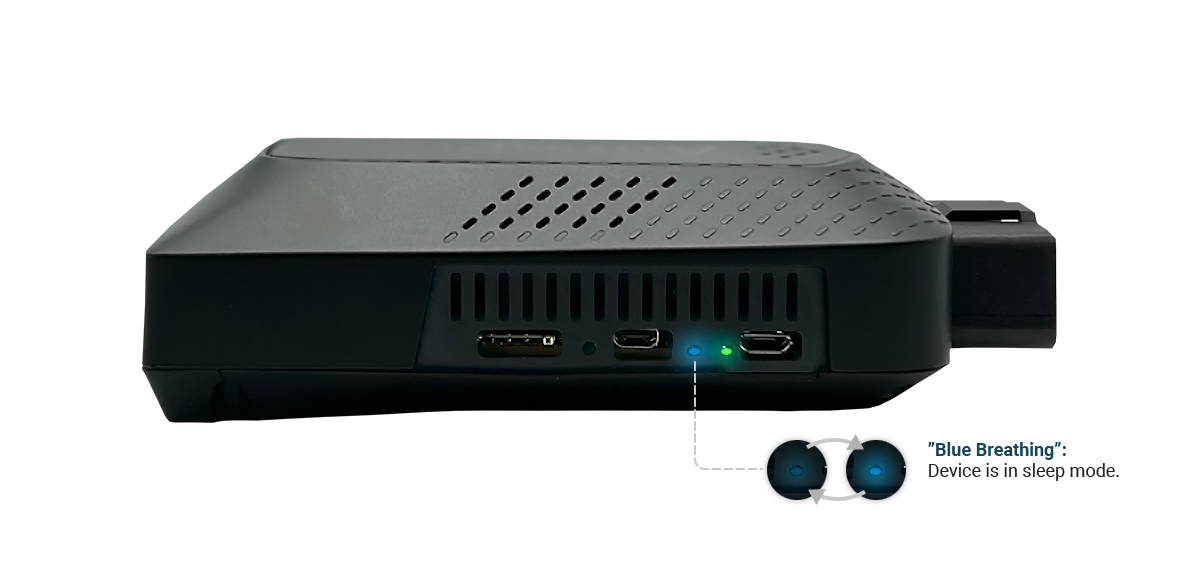
A common reason for missing data is a communication issue between your AutoPi TMU CM4 device and the cloud. If you followed the Getting Started guide, this is typically not a problem. However, check the LED status on the side of the device to confirm it's communicating with the cloud and hasn't entered sleep mode.
- LED Status: Both the green and blue LEDs should be lit solid and bright. If the blue LED is "breathing" (varying brightness from dim to bright), the device is in sleep mode.
- Resolution: Disconnect the device from the OBD-II port, then reconnect it. Wait until both LEDs are solid before proceeding.
For more details on LED status meanings, refer to Status LEDs.
2. Internet Connectivity Issues
Ensure your device is connected to the internet. If there are connectivity issues, follow the steps outlined in the 4G Internet Setup and Troubleshooting Guide.
3. CAN Bus Creation
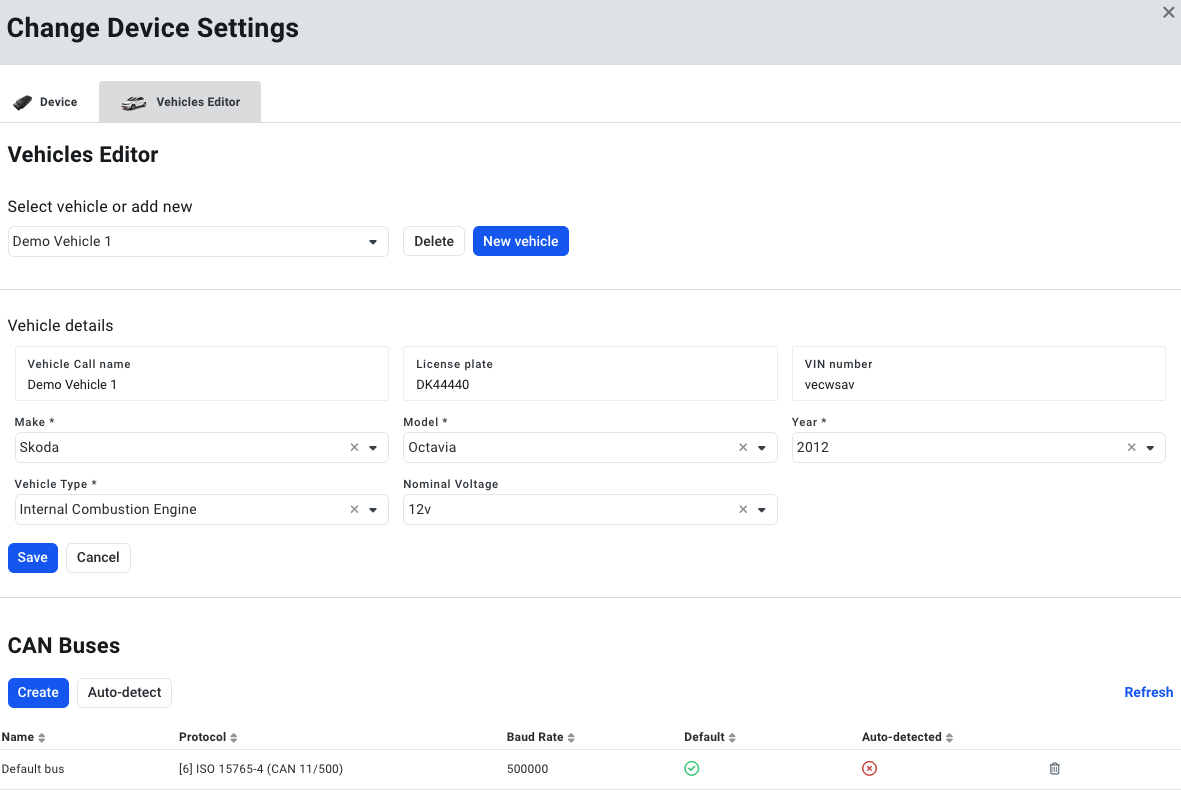
When the device boots for the first time, it attempts to autodetect the communication protocol and sends the results back to AutoPi, where a CAN Bus is created for your device.
- Check for CAN Bus: Navigate to Vehicles > Choose Device > Settings > Vehicle Editor to verify that the CAN Bus has been created.
- Manual Configuration: If the CAN Bus wasn't created automatically, you'll need to configure it manually. For assistance, refer to the CAN Bus Configuration Guide.
4. Loggers Creation
To view data on the AutoPi Cloud Dashboard, you need to create Loggers to collect the data via your AutoPi device.
- Setting Up Loggers: Loggers can be configured to communicate on the CAN Bus and capture the necessary data. They can be set up using PIDs or CAN messages, depending on your vehicle's communication type.
- Accessing Loggers: Navigate to the Devices section of the AutoPi Cloud, select your device, and find Loggers. Some default loggers may already be available and should display data in the Dashboard widgets. Depending on your vehicle, you may need to create custom loggers.
- Explore OBD Community Library: Check the OBD Community Library for loggers that have been created for your specific vehicle model and year.
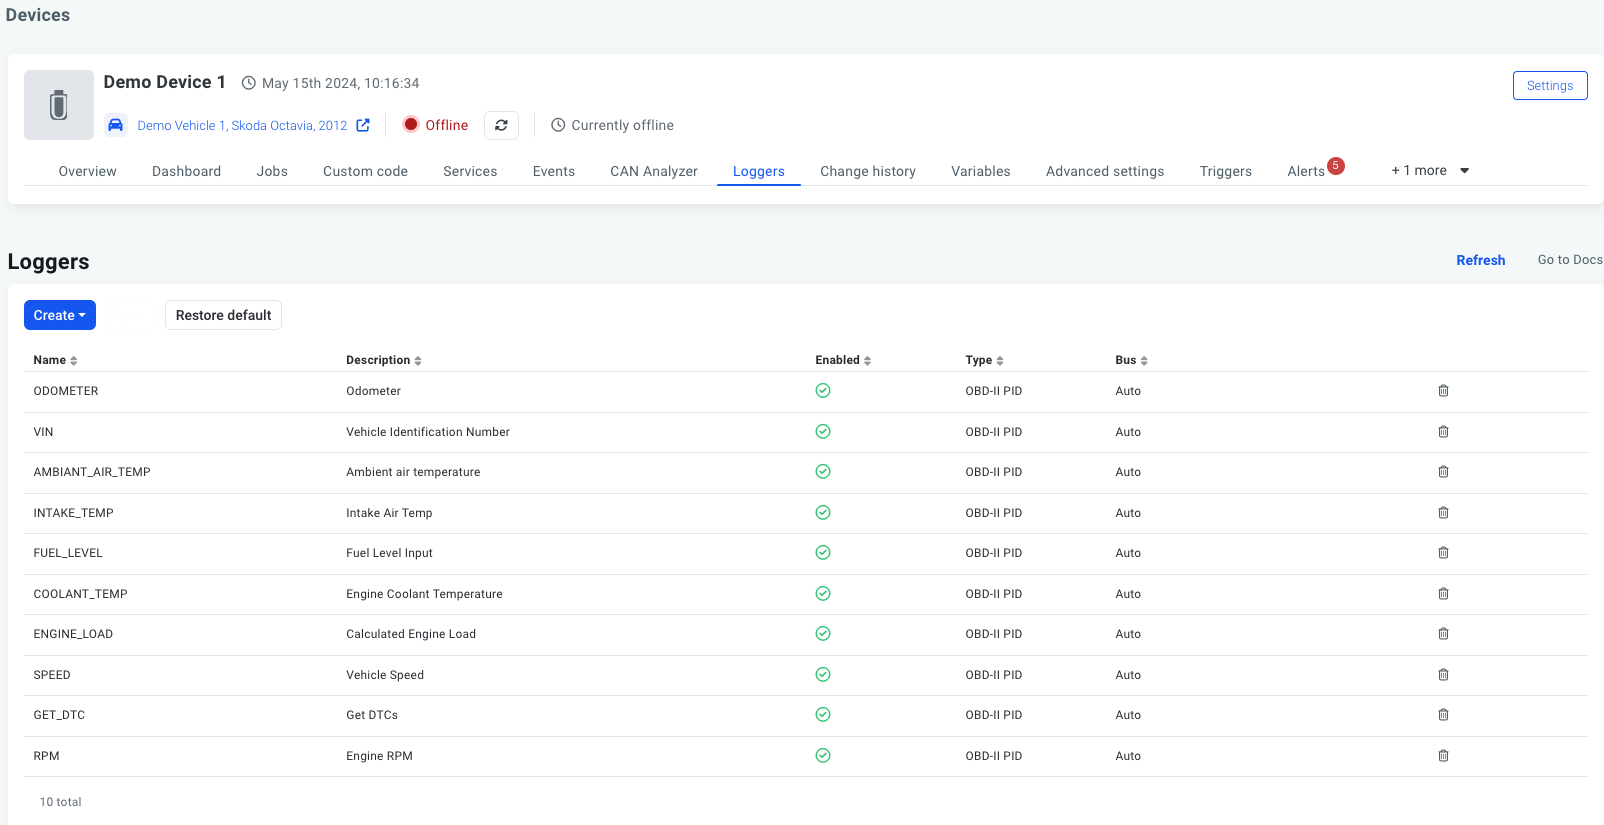
For more information on creating Loggers, visit the OBD-II Introduction Guide. Additional documentation on CAN and PID configuration is available under the OBD-II section of the Cloud documentation.
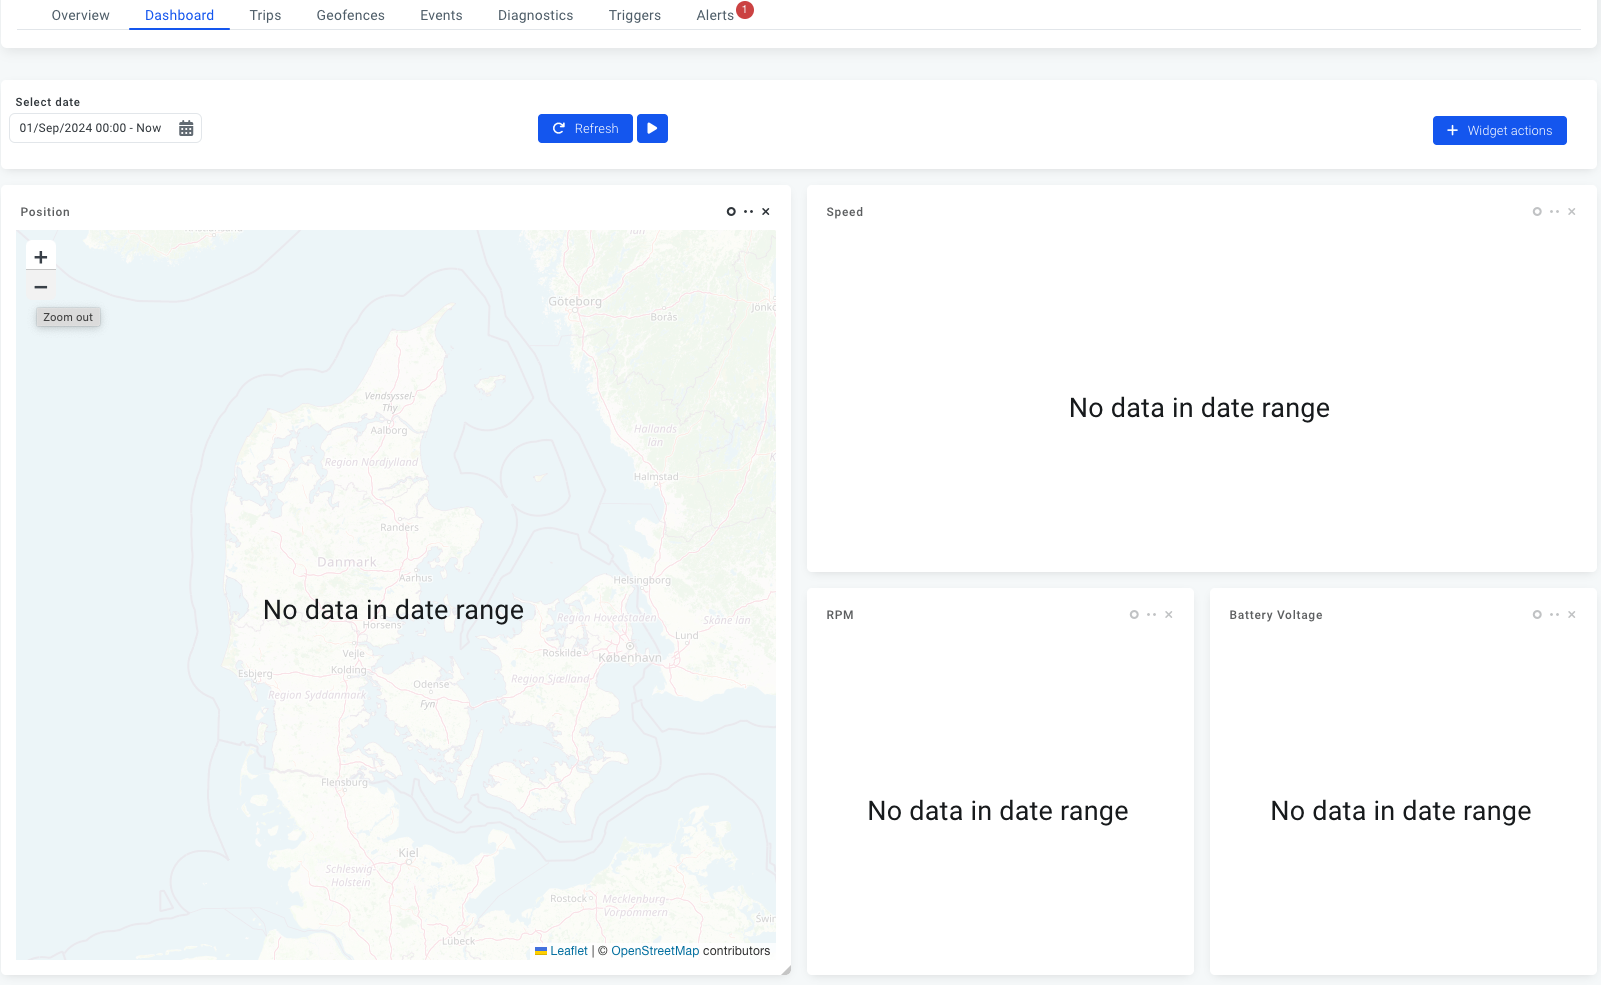
When everything is configured correctly, you should be able to see your data displayed as widgets on the Dashboard by navigating to Vehicles > Dashboard.
5. Configuring Widgets
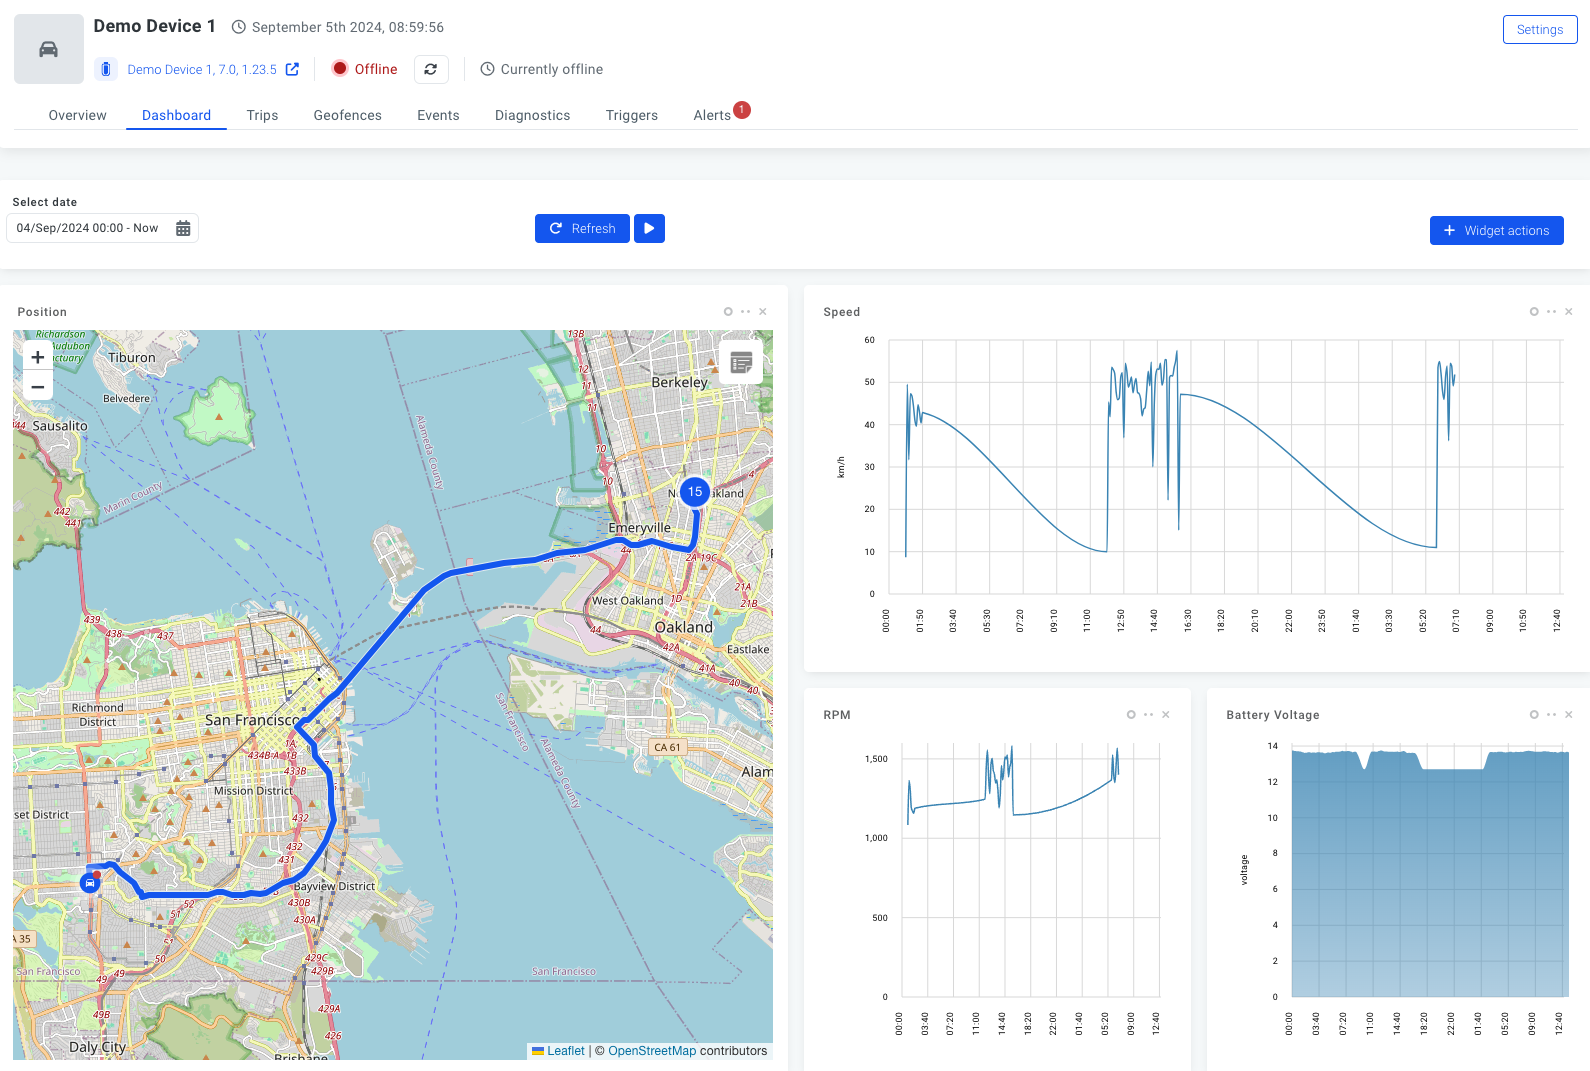
After setting up your loggers, you can view your data on the dashboard. Each widget in the dashboard has controls in the top-right corner:
- Circle icon: Refreshes the widget's data.
- Three dots icon: Opens the configuration options for the widget.
- X icon: Removes the widget. Feel free to remove any default widgets that aren't relevant to you.
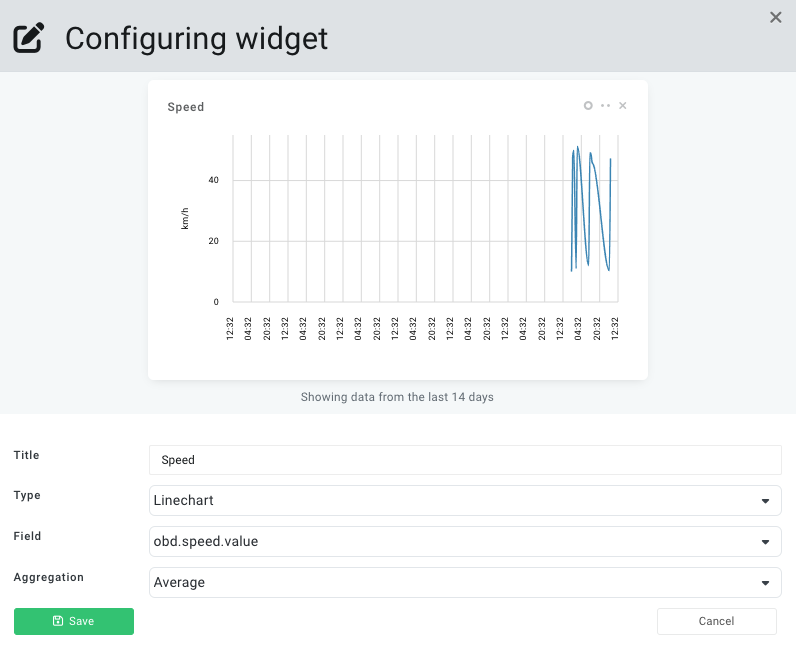
To customize how your data is displayed, click the three dots on a widget. This opens the configuration settings, where you can choose different display formats such as graphs, line charts, gauges, and more. You can also set the widget to show data averages, minimums, or maximums.
Widget Shows "No Data"
If a widget displays "No data," it's often due to incorrect configuration—especially in the 'Field' section. Ensure the widget's settings align with the configuration of the logger that collects the data for that field.
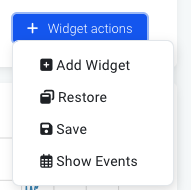
After updating your widget settings, click Save, then refresh the widget using the circle icon to check if data appears. If data displays, the configuration is correct. To save your changes for future use, click Widget Actions and select Save.
Adding New Widgets
To add a new widget to your dashboard, go to Widget Actions and choose Add Widget. Remember, a logger must be set up beforehand, or the widget won't have any data to display.
When you're satisfied with your dashboard configuration, save your layout via Widget Actions to keep your settings for future sessions.
For more detailed information on widgets, see Link Your Loggers to Your Dashboard.
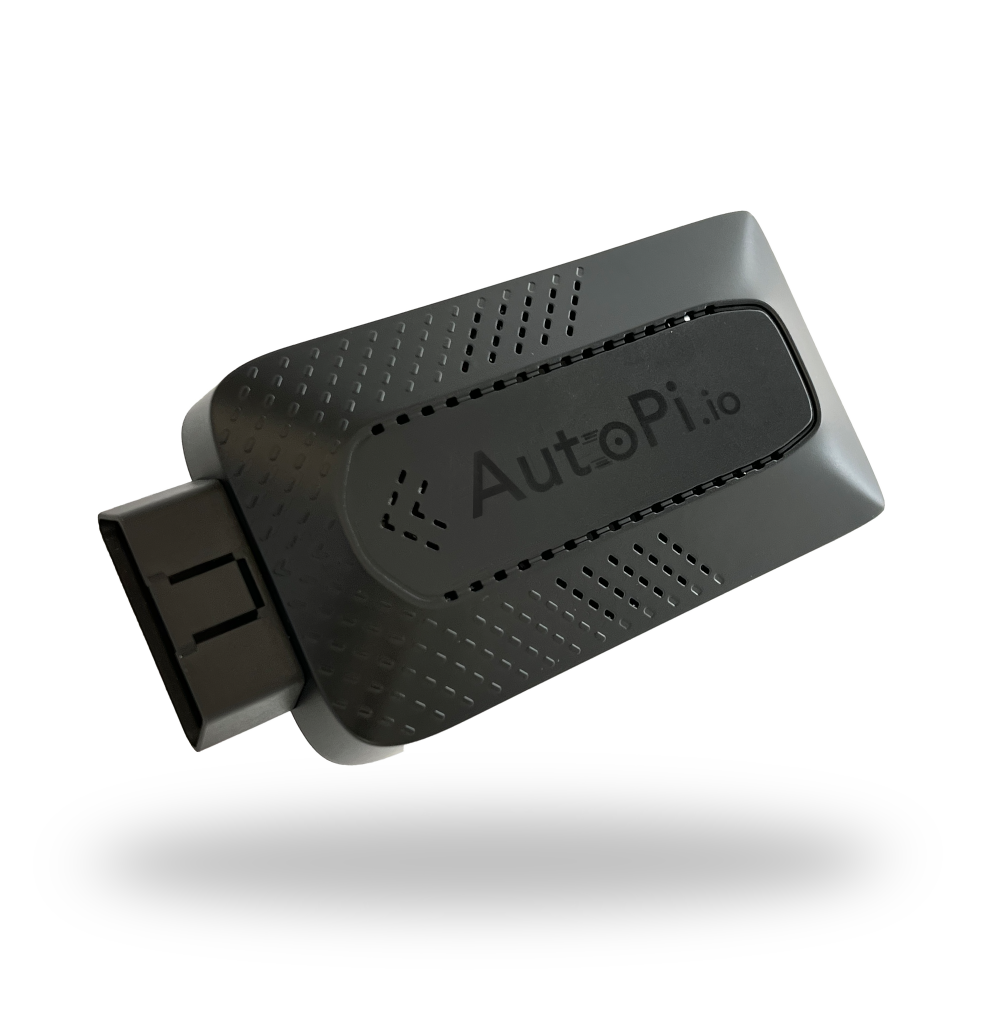 Shop AutoPi devices
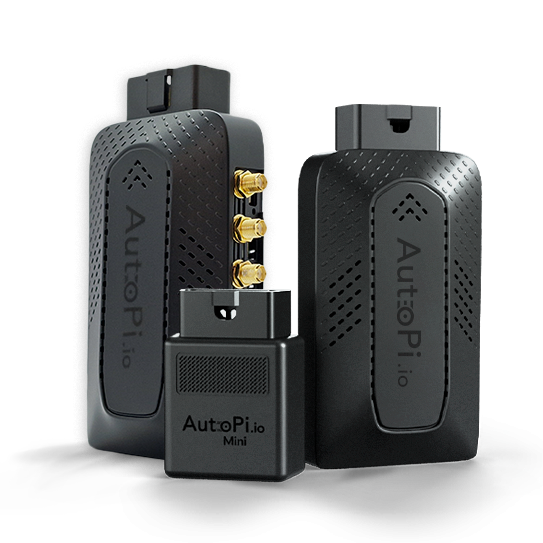 Compare devices
 Contact sales
 Contact support