Diagnostics
The Fleet Diagnostics page provides a centralized overview of all diagnostic error codes currently reported across your entire fleet. It allows you to quickly identify issues, understand their impact, and monitor how frequently they occur across multiple vehicles.
If you want to view diagnostic information for a specific vehicle only, you can do so under Vehicle → Diagnostics. You can read more about this functionality here: Vehicle Diagnostics.
What You Can See in Fleet Diagnostics
For each diagnostic error code, the Fleet Diagnostics page displays:
- Error code and description – a clear explanation of the reported issue.
- Vehicle – the vehicle on which the error occurred.
- More detailed information is available on the individual vehicle’s Diagnostics page.
- First occurrence – timestamp of when the error was first reported.
- Last occurrence – timestamp of the most recent occurrence.
- Occurrence count – how many times the error has been reported.
- State of the code:
- Active – the issue is currently present.
- Cleared – the issue is no longer active.
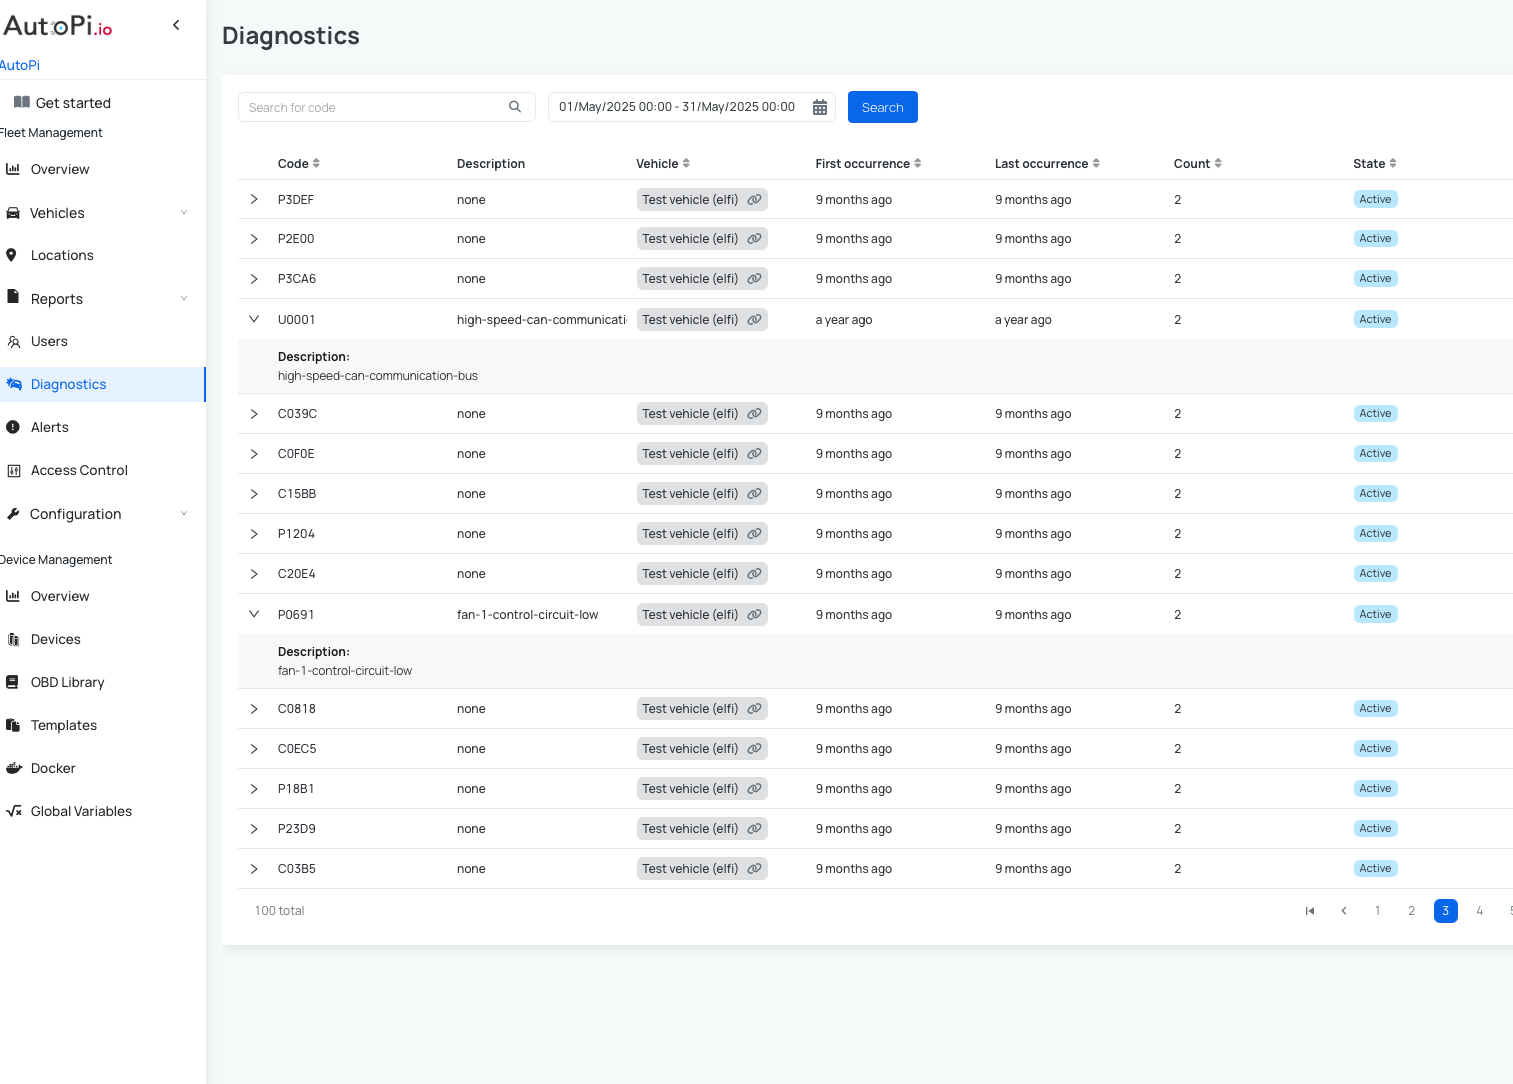
This information helps you understand not only what the issue is, but also when it started and how often it occurs.
Real-Time Monitoring and Automation
If you have special vehicles or need to define your own diagnostic logic, you can create custom Fault Codes using the Fault Codes functionality.
When Diagnostics are combined with the Fault Codes functionality, Fleet Diagnostics becomes a powerful real-time monitoring tool:
- Receive immediate notifications about critical issues via:
- Cloud alerts - read more here: How to set up cloud alerts.
- Email notifications - read more here: How to set up email notifications.
- React faster to vehicle problems and reduce downtime.
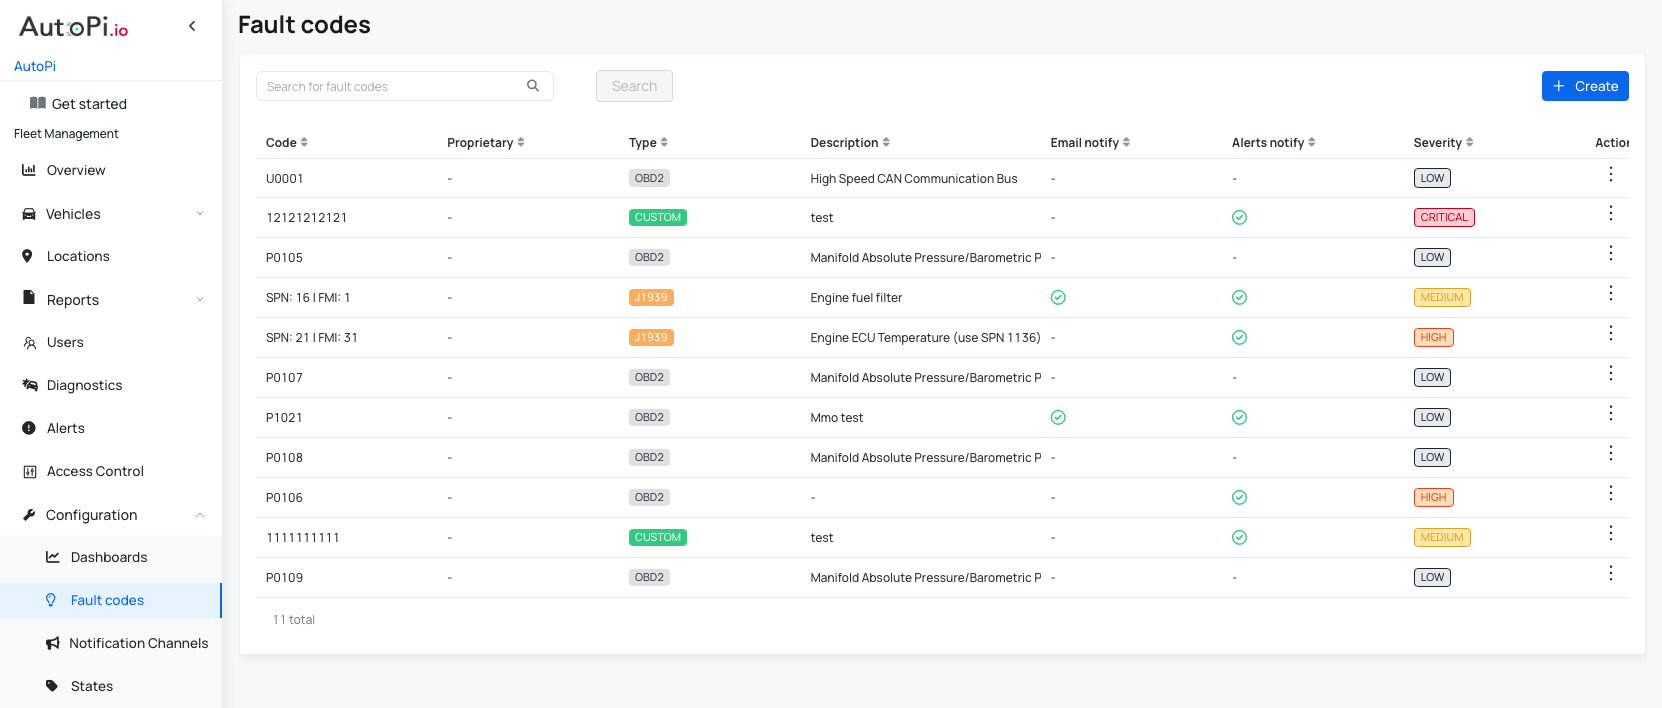
This enables a more proactive approach to fleet management and issue resolution. To learn more, see our guide: Fault Codes.
 Buy AutoPi device
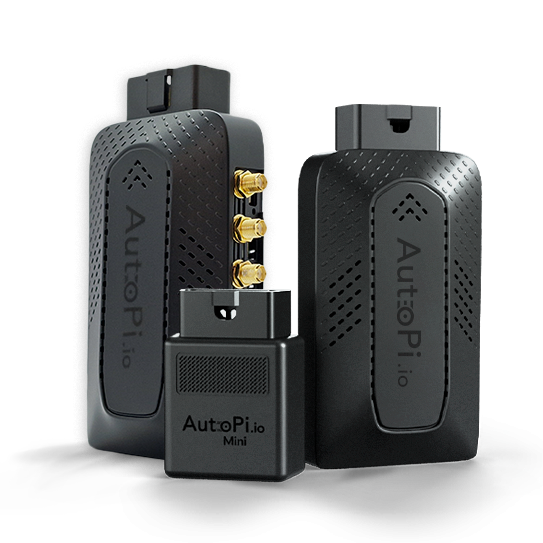 Compare all AutoPi devices
 Contact our sales team